

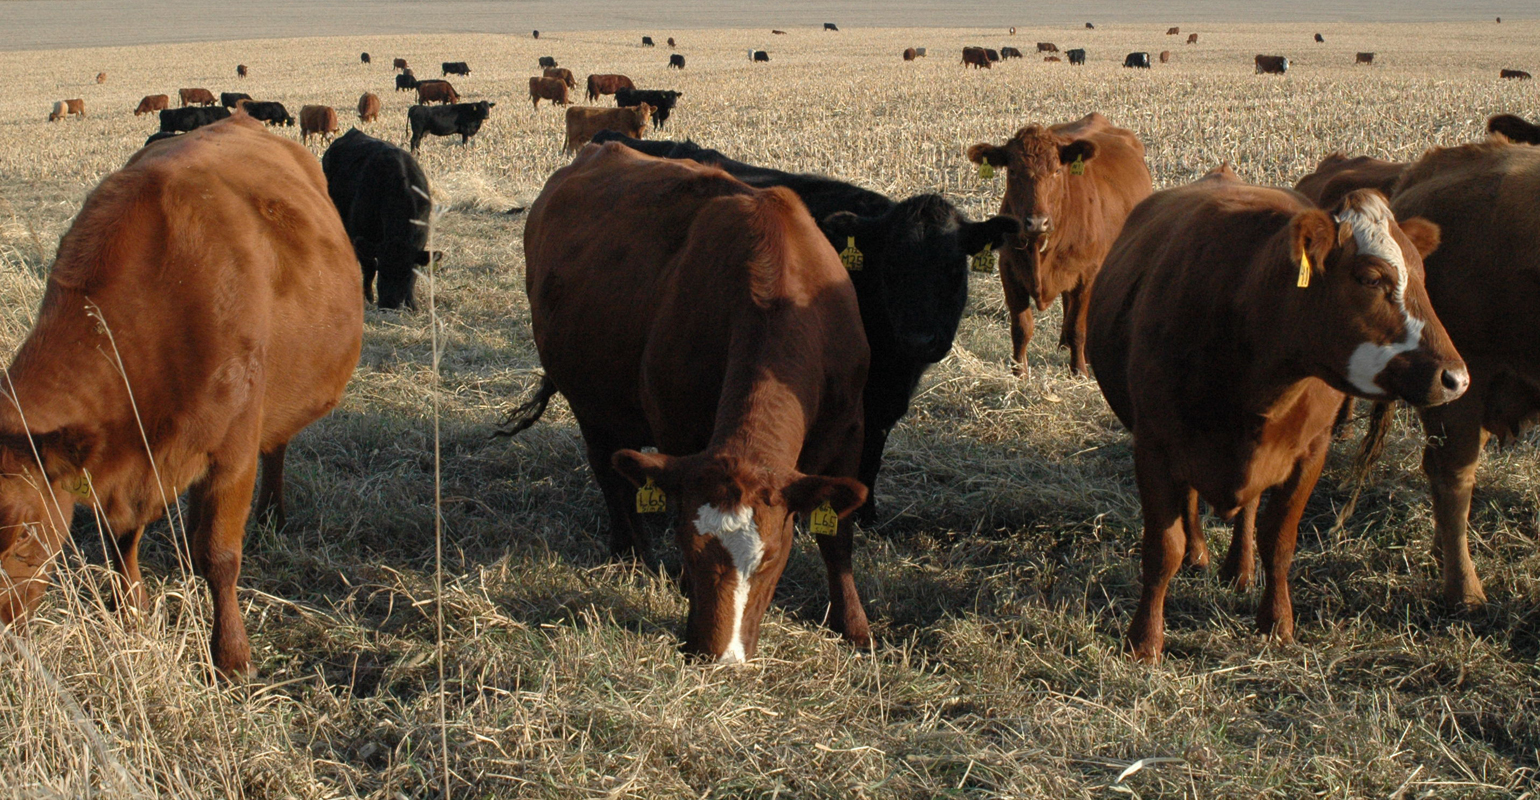

Raising cattle is not for the faint of heart ― it never has been. Last year was a testament to that.
Extended periods of very cold weather forced producers to feed more hay than normal. Supplies got squeaky tight in some areas. Wintry conditions were challenging for calving. Feedlot operators had extra work removing ice and snow. Snowy and icy roads slowed transportation. Snowmelt and rain caused major flooding, devastating large regions of the Mississippi and Missouri river basins. Mud created challenges. Wide temperature swings from cold to warm negatively impacted performance and increased animal morbidity and mortality. At the other extreme, fires devastated some grazing land.
Greening pastures always fuel optimism. Last year turned out to be an above-average grazing and forage production season. However, green-up optimism faded as cattle markets headed south.
Iowa’s average price for 550-pound steer calves fell by almost $23 per cwt from early June to the end of October, before rebounding nearly $16 per cwt by end of the year. Calf prices in 2019 averaged below 2018 levels for the year and were more than $9 per cwt lower October through December, when a lot of calves were sold.
Compared to 2018, the average annual price for 750-pound feeder steer slid by roughly $6.50 per cwt in 2019. Iowa-Minnesota slaughter steer prices in 2019 actually averaged above 2018 levels for the year but then averaged over $6 per cwt lower in September.
Cow slaughter expansion
Adverse weather and tighter cow-calf margins combined to create uncertainty about the trajectory of the cattle herd. Total cow slaughter in 2019 was up 3.8% compared to 2018. Dairy cow slaughter rose 2.3%. Beef cow slaughter climbed 5.5%. Fourth-quarter 2019 beef cow slaughter climbed nearly 15% relative to the same period in 2018. To some, the dramatic surge in beef cow slaughter suggested rising culling rates would drastically lower beef cow numbers going into 2020.
However, part of the rise in beef cow slaughter is simply due to higher cow numbers. Herd expansion sharply curtailed beef cow slaughter in 2014-17. Net beef cow culling was a record low 7.6% in 2015. What followed were three consecutive years of single-digit beef culling rates.
The long-term average annual beef cow culling rate is 9.6% and is typically higher than this level during liquidations and lower during herd expansions. The 2019 beef cow slaughter was 10% of the Jan. 1, 2019, beef cow herd inventory. Rarely does the herd increase when the annual beef cow slaughter exceeds 10% of the beginning inventory. Typically, beef cow slaughter must be below 9% of the Jan. 1 count to cause the cow herd to grow year over year. In other words, the industry is returning to normal beef cow culling rates. Beef cow slaughter in 2019 was consistent with some herd contraction.
USDA released its biannual cattle inventory report Jan. 31, based on producer surveys. The report shows lower cattle numbers for most inventory categories. The National Ag Statistics Service estimated the Jan. 1, 2020, inventory of all U.S. cattle and calves totaled 94.413 million head, down 0.4% from the Jan. 1, 2019, inventory of 94.805 million head. Beef cows, at 31.317 million head, were down 1.2% or 374,000 head from a year earlier.
Trying to get in position
Cow-calf profitability has been slowly eroding. The last two years have been particularly insidious, reducing the incentives for producers to hold back heifers. However, some recognize that a carrot is out there, potentially a pot of gold, when prices get stronger. Prices of 2014 and 2015 are not all that far in the rear-view mirror. At minimum, forecasts call for year-over-year increases in both calf and yearling prices in 2020. You have to play the game to be able to win the game, so to speak.
This thinking may help explain why the inventory of beef replacement heifers was down only 1.9% from Jan. 1, 2019. On average, analysts expected this number to decline 3.5% from Jan. 1, 2019. The question is whether producers may adjust their intentions as 2020 progresses. Producers can easily divert open replacement heifers into feeder markets if their expectations dim.
Forced culling in 2011-12 meant the beef cow herd was young in the early part of the last decade. As the decade progressed, producers trimmed culling rates and retained more heifers to expand. Now the herd is older. Producers may be keeping more heifers than expected to replace older cows, cows with health problems, cows with reproductive issues, or all these factors.
Other heifers 500 pounds and over were up 0.9% to 9.706 million head. This is the highest other heifer inventory estimate since Jan. 1, 2011. Other heifers are heifers that will not be bred or used as replacement animals for the beef or milk cow herd. On average, analysts expected this number to rise 2.3% from the previous year. Analysts guessing more heifers would show up as other heifers than actually did reinforces the notion that producers are accelerating replacing aging cows.
Using the inventory categories for steers and other heifers over 500 pounds along with calves under 500 pounds, and subtracting the cattle already in feedlots leaves a Jan. 1 estimated feeder cattle supply outside of feedlots of 26.448 million head, down 0.4% from Jan. 1, 2019. The total inventory of steers, other heifers and calves was up 0.5%, but large feedlot placements in 2019 pulled the feedlot inventory up 2.1% year over year, meaning that more of those feeder cattle were already in feedlots on Jan. 1, 2020. Strong projected cattle feeding closeouts for the first half of 2020 motivated aggressive late-2019 feedlot placements.
The stable to slightly smaller feeder cattle supplies are supportive of calf and feeder cattle prices this year. Feeder cattle supplies on Jan. 1, 2020, are still the third largest since 2012. That means feedlots should be able to find cattle to place, and prices should not be prohibitive.
Small feedlots holding steady
In addition to the biannual cattle inventory report, USDA’s monthly January Cattle on Feed report for feedlots over 1,000-head capacity released Jan. 24 provides more information. Cattle on feed Jan. 1, 2020, totaled 14.668 million head, up 2.1% from last year as mentioned above. The monthly report said the number on feed Jan. 1 in feedlots with capacity of 1,000 head or more was 11.958 million head, up 2.3% year over year. Thus, the number of cattle on feed in feedyards with capacity of 999 head or less was 2.71 million head, up 1.2% from the start of 2019. The small feedlots’ share of the total number on feed has been between 17.4% and 20% since 2000, and is at the 20-year average of 18.5%.
The 2019 U.S. calf crop was estimated at 36.06 million head, down 0.7% from 2018’s calf crop. Calves born during the first half of 2019 were estimated at 26.35 million head, down 0.4% from the first half of 2018. Calves born during the second half of 2019 were estimated at 9.71 million head, down 1.6%. The 2019 calf crop as a percent of the total cow herd on Jan. 1, 2019, was 87.9%. This ratio was over 88% in 2015-2018, peaking at 88.8% in 2016 and 2018. Thus, the current level of 87.9%, while down from recent years, is still above the levels seen in the previous years where weather may have played a role in the size of the calf crop.
Impacts of cold, snow, floods and fires on cattle producers in 2019 made dramatic headlines. The inventory data gathered from producers suggest the total impact on herd size was relatively small. Still, individual operations suffered devastating losses. The loss of animals, fence, pasture and other resources was a significant burden on the families and operations directly involved.
Cattle producers are hardy, resilient folk. But emotional healing and financial recovery take time. An old saying says, “Trying times bring top managers to the surface.” And they’re doing it again.
Schulz is the Iowa State University Extension Livestock economist. Email [email protected].
Recent Comments