


Introduction
Housing is a very important long leading indicator for the economy (as in, 12 to 18 months out).This is both because of the long period of time during which money is spent on building the house, and the subsequent period of landscaping and furnishing the house and property.
For more than five years, see for example, here, here, here, here, and here, I have had a simple mantra to explain the housing cycle:
- Interest rates lead sales
- Sales lead prices
- Prices lead inventory
The housing data released over the past several weeks shows the correctness of this formulation of the housing cycle perfectly, with implications for the next 12 – 18 months. Let’s take a comprehensive look.
The Housing Cycle as of February 2020
1. Interest rates lead sales
Housing, measured YoY in the graph below (red) by single-family permits, tends to follow mortgage rates (inverted, blue) with about a four- to six-month lag (shown YoY%)
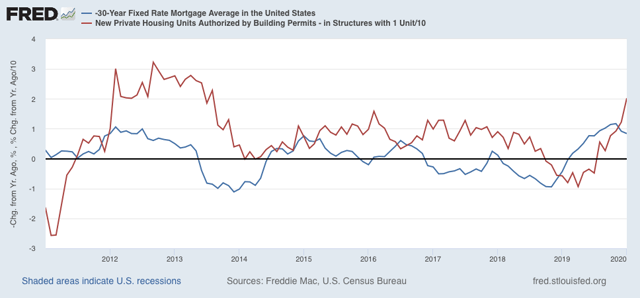
Mortgage interest rates peaked in November 2018, made lows last September, and then new lows in the past several weeks. Single family permits made a low 5 months later in April 2019, and have rebounded since.
2. Sales lead prices
Here are single-family permits again (red, left scale) and the FHFA house price index (blue) and the Case Shiller National index (green, deflated by average hourly earnings, right):
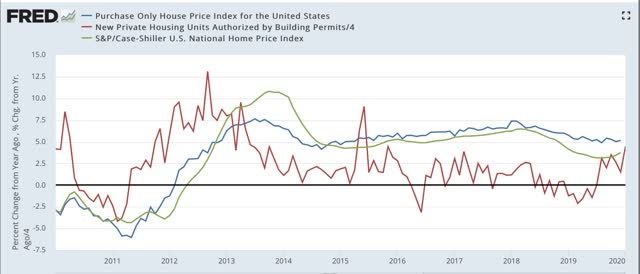
The trough for both the FHFA and the Case Shiller indexes was last August. The YoY change increased m/m for the FHFA from 4.9% to 5.1% in December. For the Case Shiller national index the YoY rate of change increased from 3.5% to 3.8%.
3. Prices lead inventory
Yesterday morning new home sales and inventory were reported. Below is a graph of the FHFA purchase only house price index (GOLD), the Case Shiller national index (red) and inventory of new homes for sale (green) measured YoY:
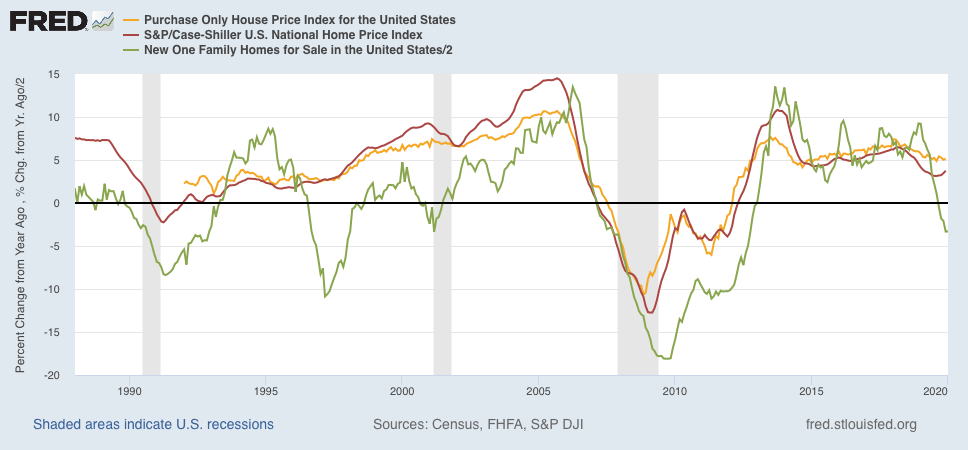
With the exception of the 1999-2002 portion of the housing bubble, inventory has lagged prices.
Finally, BillMcBride a/k/a Calculated Risk says every month that he looks at inventory for clues to the trajectory of housing sales. As I’ve shown above, it is clear that sales (red in the graph below) lead inventory (green). That being said, when we go to the first derivative, and look at the YoY% *changes* in inventory, it does help us forecast the near term trajectory of sales:
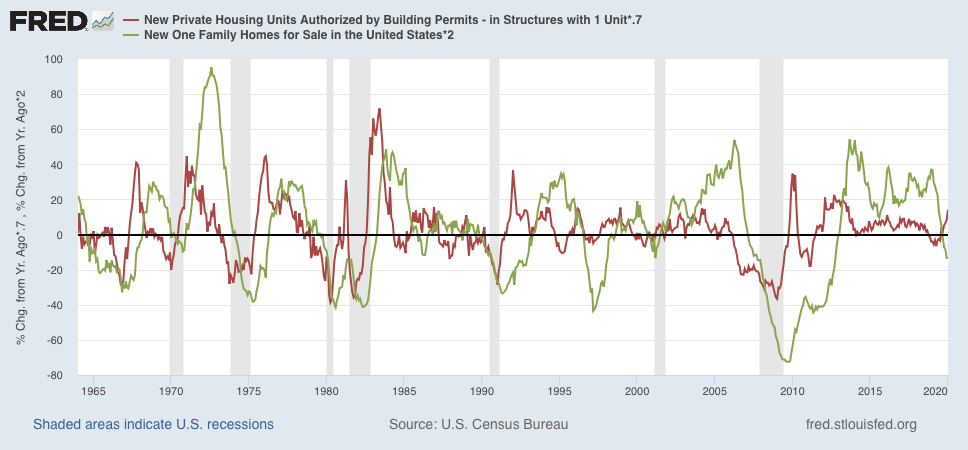
When the trajectory of inventory changes (green) has been rising i.e., either inventory declines are decelerating, or inventory gains are accelerating) that tells us that sales growth is going to decelerate, or in the latter case, decline. Conversely, with the exception of 1990, if the trajectory of inventory changes has been falling (either decelerating gains or accelerating declines), that tells us that sales are likely to increase.
Conclusion: Implications for the remainder of 2020
February’s housing reports all have shown the continuing validity of the housing cycle mantra I have written about for going on a decade.
As shown above, until the last week or so, over the past 6 months interest rates have generally gone sideways. That tells us to expect that increases in the absolute levels of housing sales, permits, and starts are likely to at very least slow down in the months ahead (since interest rates lead sales by about 4 to 6 months). On a YoY basis, however, sales are likely to continue to post increasing gains.
Since sales have increased for nearly a year, the decelerating in price gains that bottomed late last autumn is almost certainly over. Accelerating price gains are likely in the months ahead (which will crimp potential buyers’ budgets).
Inventory has probably just bottomed. On a YoY basis it is still accelerating to the downside. Aside from possible impacts from coronavirus, there is no reason to expect sales to turn down anytime in the immediate future.
Disclosure: I/we have no positions in any stocks mentioned, and no plans to initiate any positions within the next 72 hours. I wrote this article myself, and it expresses my own opinions. I am not receiving compensation for it (other than from Seeking Alpha). I have no business relationship with any company whose stock is mentioned in this article.
Recent Comments