

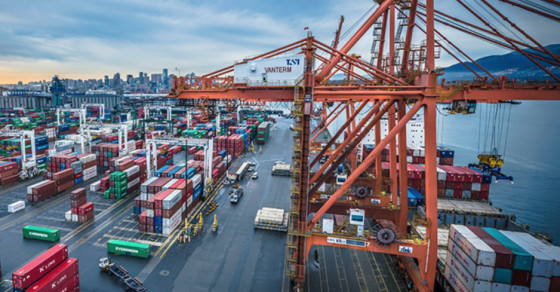

Vancouver Fraser Port Authority (VFPA) cargo volumes declined two per cent in 2019 compared with a record 2018 year, annual results released earlier this week show.
VFPA president and CEO Robin Silvester said labour disputes, trade disputes and, more recently, the growing coronavirus situation and rail and road blockades have affected port business.
“When you add it all up, we are a bit lower,” he said. “Generally, we have been getting business by being competitive.”
But, Silvester said, a downside is the loss of business to other ports — particularly on the container side.
Total cargo was down to 144 million tonnes from 147 million with declines in foreign petroleum products and domestic forest products.
Declines were offset by record growth in other sectors including potash, grain and containers.
Between 2018 and 2019 total tonnage was up 3.5 per cent to 147 million tonnes from 142 million tonnes, while between 2016 and 2017 tonnage increased five per cent.
The port last year moved a record number of shipping containers, measured by 20-foot-equivalent units or TEUs, at 3,398,860 TEUs, a slight increase of 0.1 per cent over 2018 results.
In 2018, the port realized a three per cent increase in TEU movement: 3,396,449 compared with 3,252,220 in 2017. Between 2016 and 2017, TEUs rose 11 per cent.
Cargo sectors saw the following changes:
- Breakbulk cargo decreased 5.7 per cent to 17.2 million tonnes.
- Wood pulp declined 6.2 per cent, while logs decreased 5.8 per cent.
- Bulk-dry cargo increased 0.9 per cent to 91.1 million tonnes. Coal decreased 1.8 per cent while gains included grain (0.9 per cent), potash (two per cent) and sulphur (8.9 per cent).
- Bulk liquid tonnage was down by 25.5 per cent over 2018 due to a 34.6 per cent decrease in petroleum products and a 10.8 per cent decline in canola oil.
- Cruise passenger traffic was up 20.4 per cent.
The number of foreign vessel calls decreased to 3,104 from 3,145 in 2018.
The port’s Canada Place cruise terminal received a record 1.1 million cruise passengers, a 20 per cent increase over 2018 and a reflection of continued demand for Alaska cruises.
“We saw strong trade growth through the port during the first half of 2019 that reached record levels, and a softening in the back half due to various issues affecting global markets,” Silvester said. “Despite these challenges, and during one of the most uncertain years for global trade, we still saw the second highest volume of cargo through the Port of Vancouver to date.
Silvester said that volume reflects the diverse number of trading partners and range of cargo handled by port terminals, “which ensures the entire port remains resilient, regardless of variations in any one sector or commodity.”
The port had faced 2019 uncertainties as a result of job action on the docks in May and at Canadian National rail operations in November.
Those actions resulted in loss of container volumes, Silvester said. “It’s not good for our reputation.”
While the sector is forecast to continue to grow, 2019 results reflected factors including trade conflicts and shipping lines adjusting to market conditions.
The port said container trade is driven by Canadian demand for imports, and the resulting availability of empty containers being essential for Canadian shipping of goods to international markets.
“Approximately $1 in every $3 of Canada’s trade in commodities and goods beyond North America move through the port, much of it in containers,” the port said.
The port said strong global demand for Canadian grain resulted in a new record of 28.3 million tonnes for both containerized and bulk cargo, a 3.5 per cent increase over 2018. Wheat was up by 16 per cent and specialty crops 14 per cent.
Those increases, however, were offset by 19 per cent decrease in canola exports and 37 per cent decrease in grains overall to China as a result of tariffs and trade challenges.
Other notable results include a two per cent rise in potash exports to a record 9.4 million tonnes and a 42 per cent decline in the movement of foreign petroleum products through the port.
“Year-over-year fluctuations in volumes through the port for this sector are not uncommon and were largely affected by U.S. refineries buying crude from U.S. sources, use of transportation alternatives, and product pricing.”
Domestic forest products declined six per cent due to a reduction in local milling activities.
The number of automobiles imported through the port was down by one per cent, mostly as a result of lower Canadian sales.
Projected container trade growth has resulted in the port leading two container terminal projects as well as working with government and industry to invest in road and rail and other infrastructure projects to smooth the supply chain.
The Centerm container terminal expansion project will increase the terminal footprint by 15 per cent and reconfigure terminal operations for a capacity increase of about 65 per cent.
The proposed new Roberts Bank Terminal 2 Project would add nearly 50 per cent more container capacity to the Port of Vancouver.
These projects are needed to meet the forecasted demand for trade of goods in containers, and will serve Canadians well into the future, Silvester said.
“As Canada’s international trade continues to grow, it is our job as a Canada port authority, along with all those who make up the Port of Vancouver, to make sure the port is ready to handle the increasing trade through Canada’s West Coast.”
@jhainswo
Recent Comments