

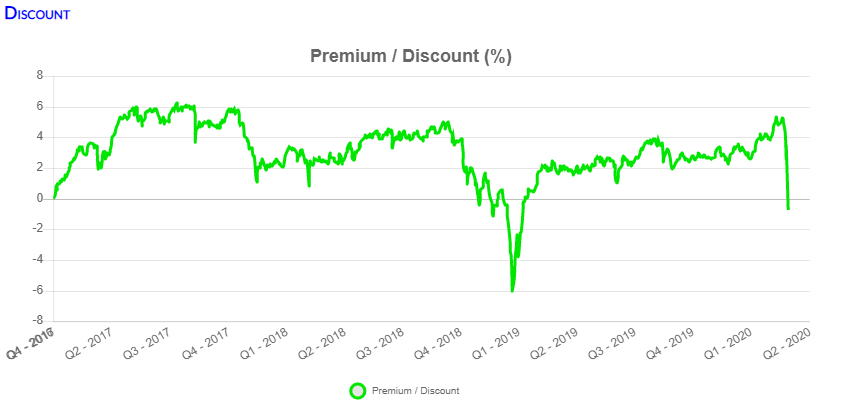

For the first time in awhile, we have buying opportunities broadly in the closed-end fund space. It has been 14 months since the swoon of late 2018 when an interest rate-fueled selloff sent the equities into a bear market. It also caused CEF discounts to widen out significantly as investors feared higher rates – both on the short and long end of the curve.
On the short end, it causes borrowing costs to rise while the long end can cause NAVs to fall. Over time, higher long-term rates can be a good thing as they can reinvest maturing positions into higher yielding bonds.
The CEF market is no longer rich as discounts widened out significantly in the last week. The average fund widened its discount by 4.1% but some funds saw much further widening or premium collapse. In fact, as mentioned earlier some funds widened out by as much as 15% or more.
Be wary of stale NAV funds which do not fully reflect the true value of the fund. One example would be Eagle Point Credit Corp (ECC) which saw its premium decline by a tremendous 35% on the week. That’s because the NAV is very stale as it only updates monthly. Clearly it will be adjusted lower – it was down ~5% in January alone. I expect ECC’s NAV to fall by 18% for February which means that the premium is really ~40% and not the 22.7% that is currently reflected.
Discounts across the CEF space have blown out. No sector was spared. Below is the CEFAdvisors High Income Index. It provides a good comparison of where we were in 2018, the run up in the last 14 months, and where we are today.

Discounts had inched very close to par reaching just -2.7% on Feb. 22. But the end of the next week, the discount had blown out to over -7%. That’s a very sharp move. The only other time I experienced such a dramatic widening of discounts was in 2008. We are still above where we were on Christmas eve 2018 but another few days of what we experienced last week and we will get there. The big difference between then and now was that the 2018 event was driven by higher rates. Today, it’s more about general uncertainty. Looking back at 2018, it was fairly easy to see the opportunity that was available. Today, it’s less so. There are a lot of unknown variables this time which prevents us from “backing up the truck.”

In total, 433 of the 505 funds are now at a discount. A week ago, 361 funds were at a discount. The average yield of the CEF universe increased by an incredible 76 bps from 6.61% to 7.37%. With interest rates at record (and microscopic) lows, yields in the vicinity of 8% are extremely compelling even if accompanied by a 1% NAV decay and higher volatility.
What We Are Advising Members?
The news flow over the weekend remained risky but not as bad as feared. It could have been far worse. We did receive news that the first U.S. citizen died from the COVID-19 virus. And that others in the Pacific Northwest and California are suspected of contracting it. Still, it appears that the second derivative of the virus spread is dropping. That does NOT mean we are out of woods yet.
However, we think we can continue “nibbling” at opportunities. We recently released our monthly letter in which we identified some great buying opportunities that we think offer downside protection. Essentially, we assessed which funds fell the most on price while not seeing significant NAV declines. Of course, one has to have familiarity with the funds to make sure the NAVs accurately reflect the prices in the market today.
You can do this by looking at the annual report. We can pick on NexPoint Strategic Opps (NHF) for a moment. Below is an excerpt from the annual report from June 30, 2019. All CEFs break down their assets into three different tier levels based on the ability for transparent pricing.
Level 1: Quoted unadjusted prices for identical instruments in active markets to which the Fund has access at the date of measurement
Level 2: Quoted prices for similar instruments in active markets, quoted prices for identical or similar instruments in markets that are not active, but are valued based on executed trades, broker quotations that constitute an executable price, and alternative pricing sources supported by observable inputs are classified within Level 2. Level 2 inputs are either directly or indirectly observable for the asset in connection with market data at the measurement date; and
Level 3: Model derived valuations in which one or more significant inputs or significant value drivers are unobservable. In certain cases, investments classified within Level 3 may include securities for which the Fund has obtained indicative quotes from broker-dealers that do not necessarily represent prices the broker may be willing to trade on, as such quotes can be subject to material management judgment. Unobservable inputs are those inputs that reflect the Fund’s own assumptions that market participants would use to price the asset or liability based on the best available information.
NHF has a significant amount of Level 3 assets. These are positions that require a thumb to the wind to figure out what they are worth. The issue many asset managers get in trouble with is that they artificially inflate these assets.

(Source: N-CSR)
You can see for NHF, there’s a significant amount of assets in the Level 3 column. This makes the NAV suspect in a fast moving, especially down, market.
OK, so when we look at which NAVs hold up best, we want to make sure that the NAV isn’t stale (for one, it’s reported daily, and second, isn’t full of Level 3 assets).
It can take a significant amount of work to compile the data to do this comparison, especially in real time. And then that just starts the analysis. In the screen below, we looked at fund that had the best NAV performance in the last week.
 Some observations:
- Taxable muni funds like Nuveen Taxable Muni Income (NBB) saw decent increases in their NAVs, especially relative to the S&P 500’s drop. That was driven by the sharp drop in interest rates pushing up the long duration assets held in the fund. At the same time, the fund’s price dropped by 7.2%, widening out the discount by an amazing 9.6% in one week. For those looking for safe income streams to add to their portfolio with a good shot at capital gains, this would be a good place to look.
- The PIMCO tax-free munis, like PIMCO Municipal Income III (PMX), which we have recently highlighted as potential buys going into the week after distribution cuts and a fall in price, all did well on a NAV basis this week. Prices fell but not really by too much.
- Some preferred funds look like absolute steals today. One fund we recently highlighted to members was First Trust Inter Duration Pref & Income (FPF) which widened out by 4% on the week. There are several other preferreds that look really good too. Flaherty and Crum have a few funds like F&C Preferred Securities (FFC) which is sitting at a -8% discount and nearly a 7% yield. The NAV is down but that’s mostly a function of the lower liquidity of the individual preferred space. These securities should migrate back toward par and help the NAV.
- The PIMCO taxables with high premiums took a beating. The fund that saw the largest amount of valuation change lower was PIMCO Corporate & Strategy Income (PCN) which saw its premium fall by nearly 17%. PIMCO Corporate and Income Opp’s (PTY) premium also got clobbered falling 14.1% on the week.
- For the first time in over a year, PIMCO Dynamic Income (PDI) and PIMCO Dynamic Credit & Mortgage (PCI) look more interesting. PCI saw its premium decline by 6% on the week (price fell 7.6% and NAV fell 1.6%). PDIs premium fell by 8.7% on the week (-10.6% on price and -1.9% on NAV).
- High-yield NAVs did well on the week with our benchmark falling just 2.8% – a relatively low figure given the carnage that occurred in the equity markets. We are hesitant to add too many of these high yield or floating rate CEFs simply because we think there may be another shoe to drop. If spreads widen out to even what they were during the fourth quarter of 2018, there is a bunch more pain ahead.
Concluding Thoughts
For the time being, we are buying higher-quality positions using dry powder to leg into positions slowly. This could be a drawn-out affair and there’s a decent chance we reach a bear market again (>20% peak to trough decline). If so, we think the higher yielding funds with junkier credits in them could see significant NAV declines on top of more discount widening. So for now we are looking at areas of the market that would be defensive but are still strong values as the price declines seem over done.
Investors are raising cash where they can and these higher quality funds like NBB are prime targets for them. They didn’t get crushed like other funds so they can still lock in gains from last year by selling today and increasing their cash positions. That cash can then be used to fund more opportunistic purchases on the equity side if needed.
For now, be careful and tread lightly. Do not blow through all of your cash or safe bucket dry powder too quickly. Better to be buying on the way back up rather than buy now and see another 10% downside.
Our Yield Hunting marketplace service is currently offering, for a limited time only, free trials and 20% off the introductory rate.
Our member community is fairly unique focused primarily on constructing portfolios geared towards income. The Core Income Portfolio currently yields over 8% comprised of closed-end funds. If you are interested in learning about closed-end funds and want guidance on generating income, check out our service today. We also have expert guidance on individual preferred stocks, munis, ETFs, and mutual funds.
Check out our Five-Star member reviews.

Disclosure: I am/we are long NBB, FPF. I wrote this article myself, and it expresses my own opinions. I am not receiving compensation for it (other than from Seeking Alpha). I have no business relationship with any company whose stock is mentioned in this article.
Recent Comments