
The natural gas futures market experienced lots of volatility since late June when the price fell to the lowest price in twenty-five years at $1.432 per MMBtu. The continuous contract proceeded to recover by 91.6% by the end of August when it rose to $2.743. The low came at the end of June, just as Warren Buffett’s Berkshire Hathaway was negotiating the acquisition of the transmission and pipeline assets from Dominion Energy (D). The price tag of $4 billion in cash and $6 billion in assumed debt was likely a bargain for the value investor who announced the deal on July 5. Over the reset of July and August, the price of the energy commodity rallied, which likely increased the value of the investment. As hurricane Laura approached the Louisiana Coast, it helped push natural gas to the 2020 high that was just 16.2 cents shy of the November 2019 peak at $2.905, which stands as technical resistance in the continuous futures contract.
Meanwhile, gravity hit the natural gas market in September, and the price of the energy commodity was trading just above $2.00 per MMBtu on September 17. The latest inventory data from the Energy Information Administration was a reminder that there is plenty of natural gas in storage to meet requirements even if the winter of 2020/2021 is colder than the average. The ProShares Ultra Bloomberg Natural Gas product (BOIL) and its bearish counterpart (KOLD) are double leveraged trading tools for those looking to participate in the natural gas market without venturing into the futures arena.
Only twice before had stockpiles reached four tcf
In late 2015 and late 2016, natural gas stockpiles rose above the four trillion cubic feet level. Those were the only two instances where the Energy Information Administration reported inventory levels above the level. In late 2016, the high was at 4.047 tcf.
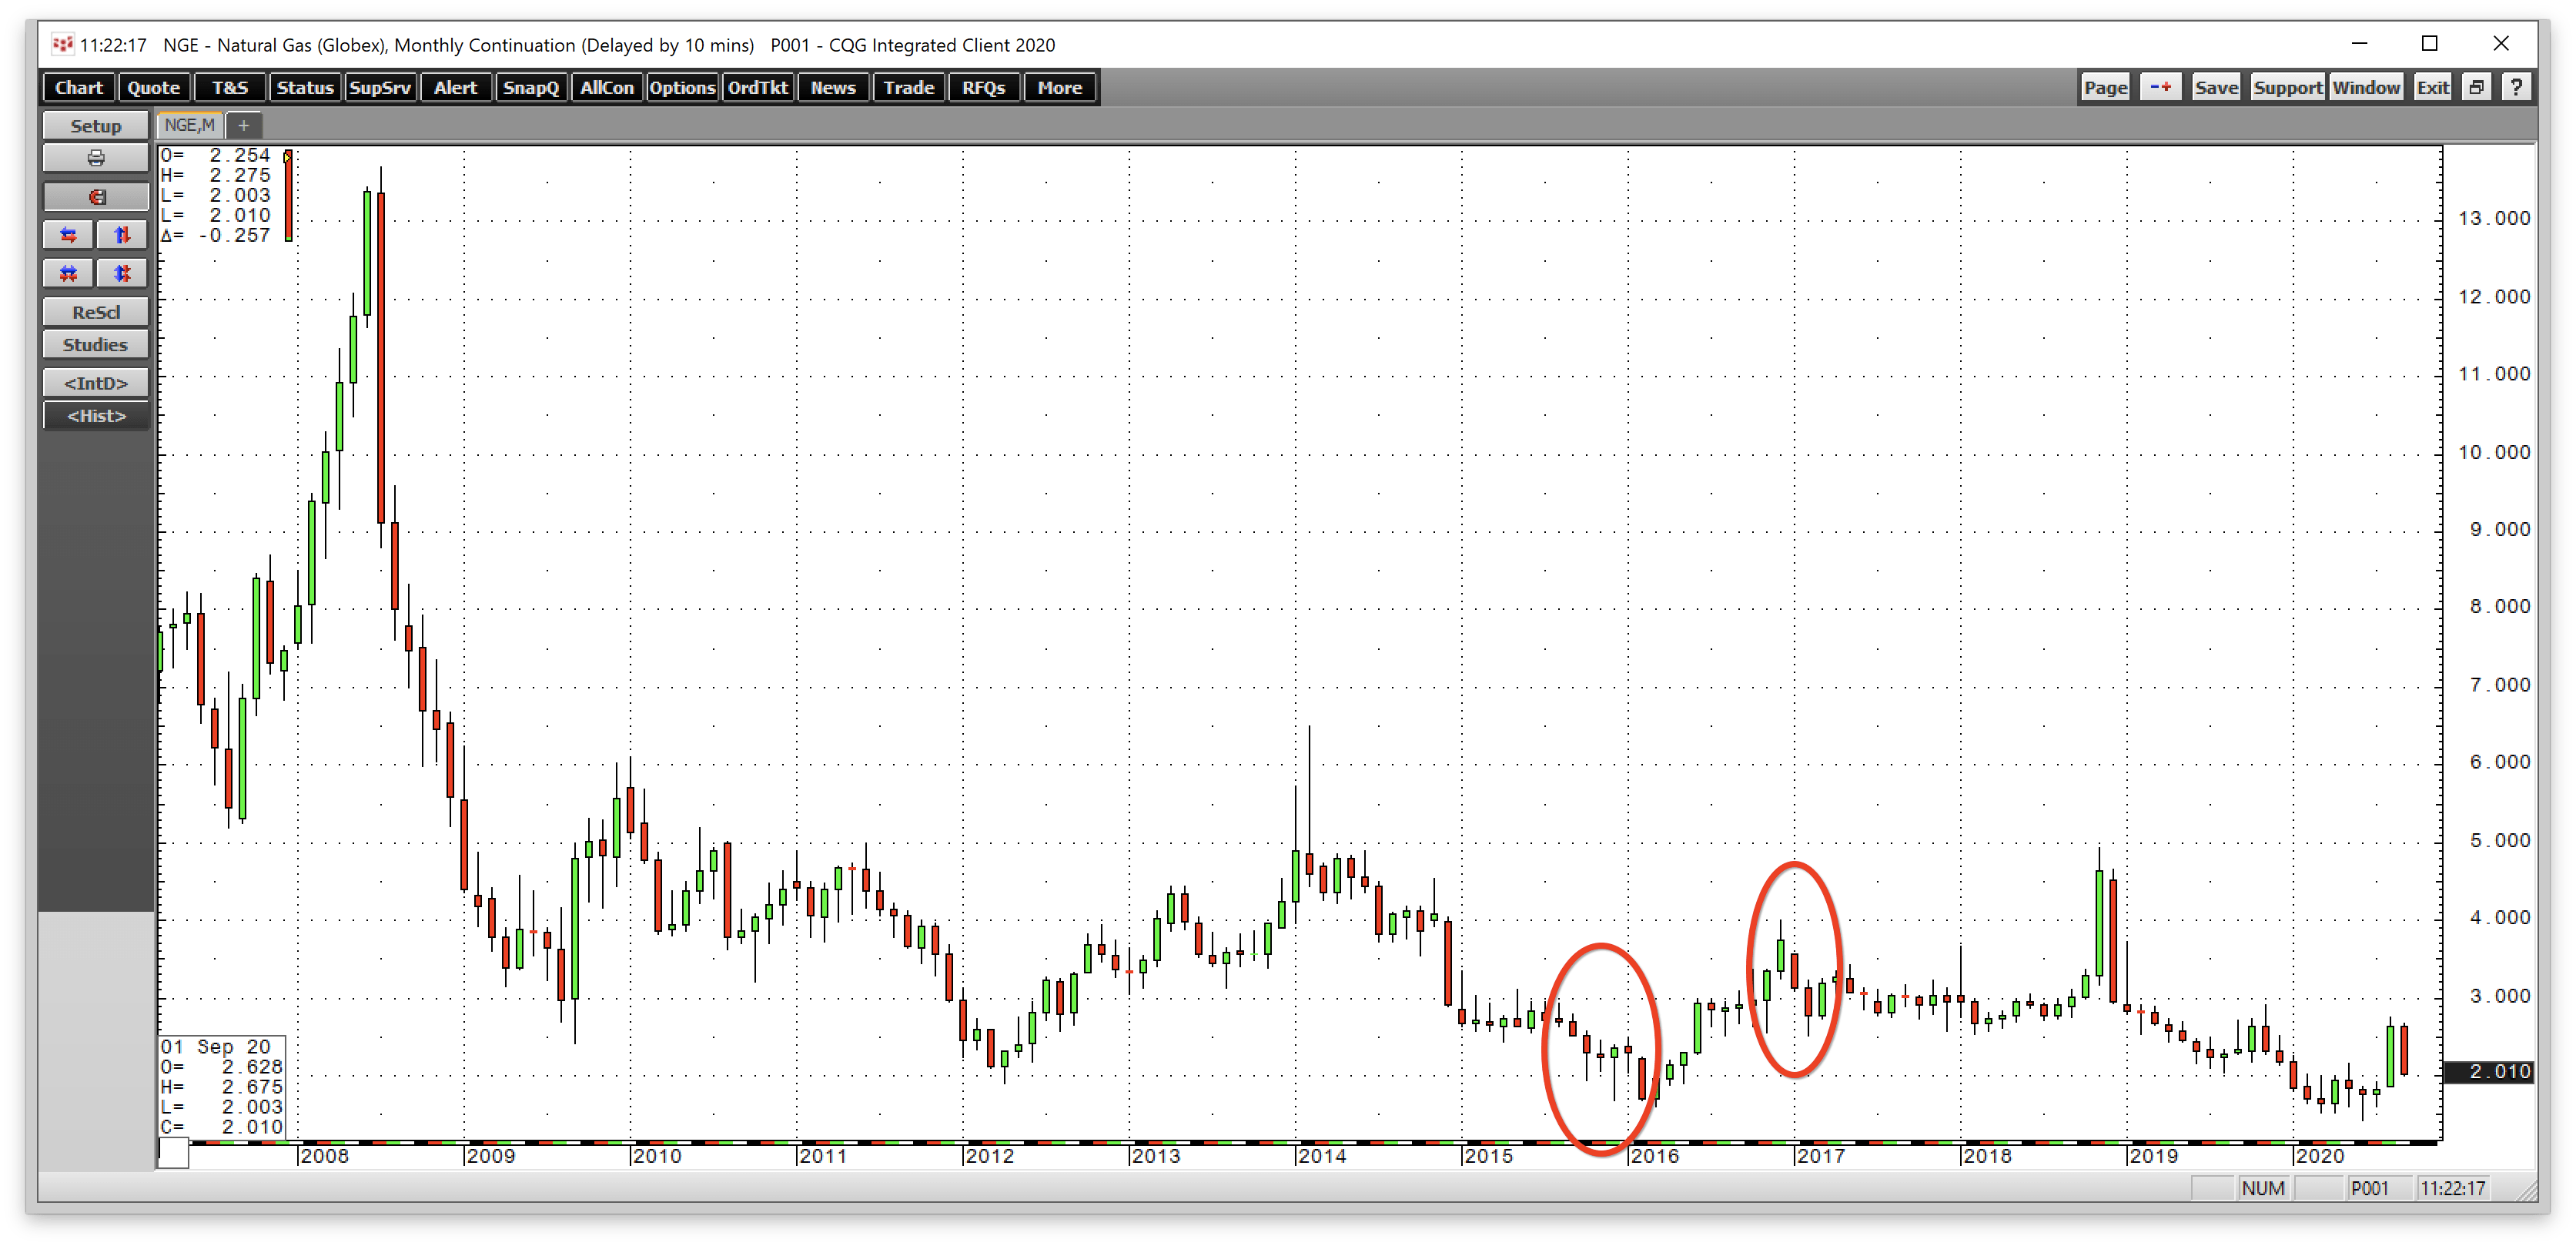
Source: CQG
As the monthly chart highlights, in late 2015 and early 2016, the first rise to over four tcf weighed on the price of the energy commodity as it peaked at $2.495 during the winter and fell to a low of $1.611 in March. During the 2016/2017 peak season, the price rose to just below $4 per MMBtu. The market had become accustomed to the level. Moreover, natural gas was replacing coal in power generation, and the market was looking forward to shipments of liquefied natural gas to consumers beyond the pipeline network.
In 2018, stockpiles peaked at 3.234 tcf, and last year the high was at 3.732 tcf.
Injections have been rising over the past two weeks
The EIA reported an injection of 70 bcf for the week ending on September 4, the highest level since mid-June. This week, the agency said they rose by 89 bcf.
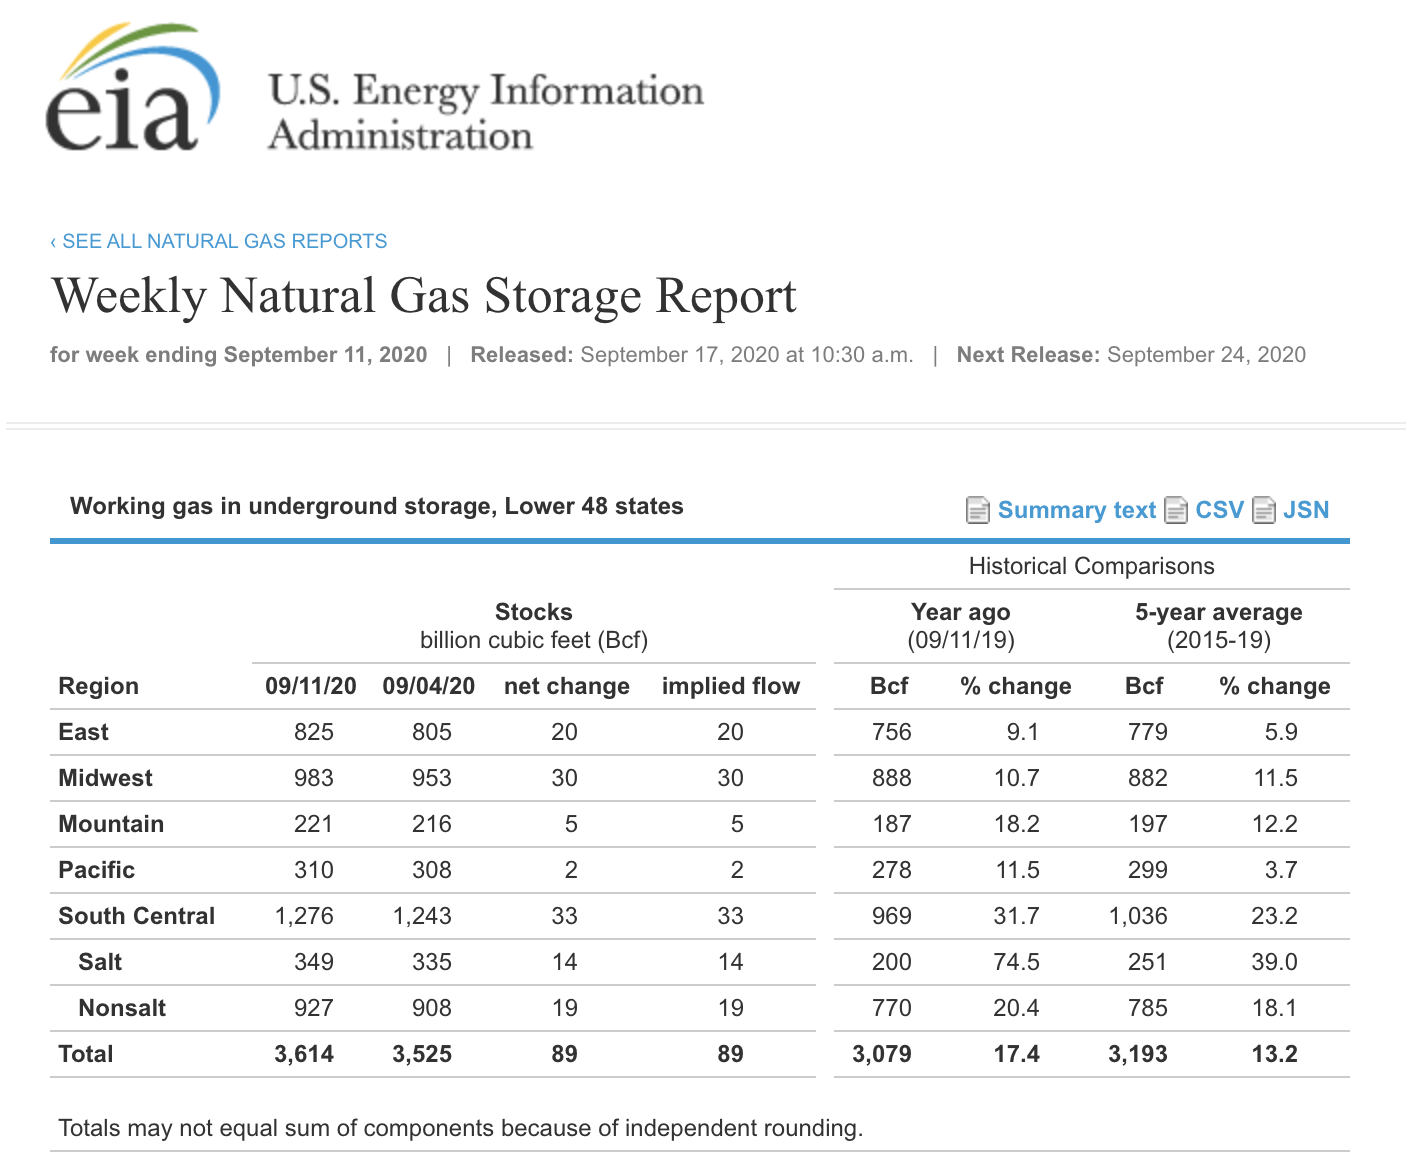
Source: EIA
As the chart shows, the injection put inventories at 3.614 trillion cubic feet, 17.4% above last year’s level, and 13.2% over the five-year average for this time of the year. While it was the twenty-fourth consecutive week where the percentage over last year’s level declined, natural gas is going into the peak season for demand with ample supplies to meet all requirements, even if the winter months are colder than the average.
Only nine weeks to go until the 2020/2021 withdrawal season
With nine weeks to go until inventories begin to decline, stocks will rise above last year’s level at 3.732 tcf. The four trillion cubic feet level is within reach. A new record high above 4.047 tcf requires an average injection of 48.2 bcf between September 18 and early November.
According to Baker Hughes, the number of natural gas rigs operating in the US stood at 71 as of September 11, 82 lower than at the same time in 2019. While fewer rigs in operation translate to lower production, demand during the global pandemic has declined.
The price of natural gas experienced a significant recovery. The continuous contract rose by over 90% over two months from late June through late August.
Natural gas ran out of upside steam at $2.743, and this week the price was back at the $2 per MMBtu level.
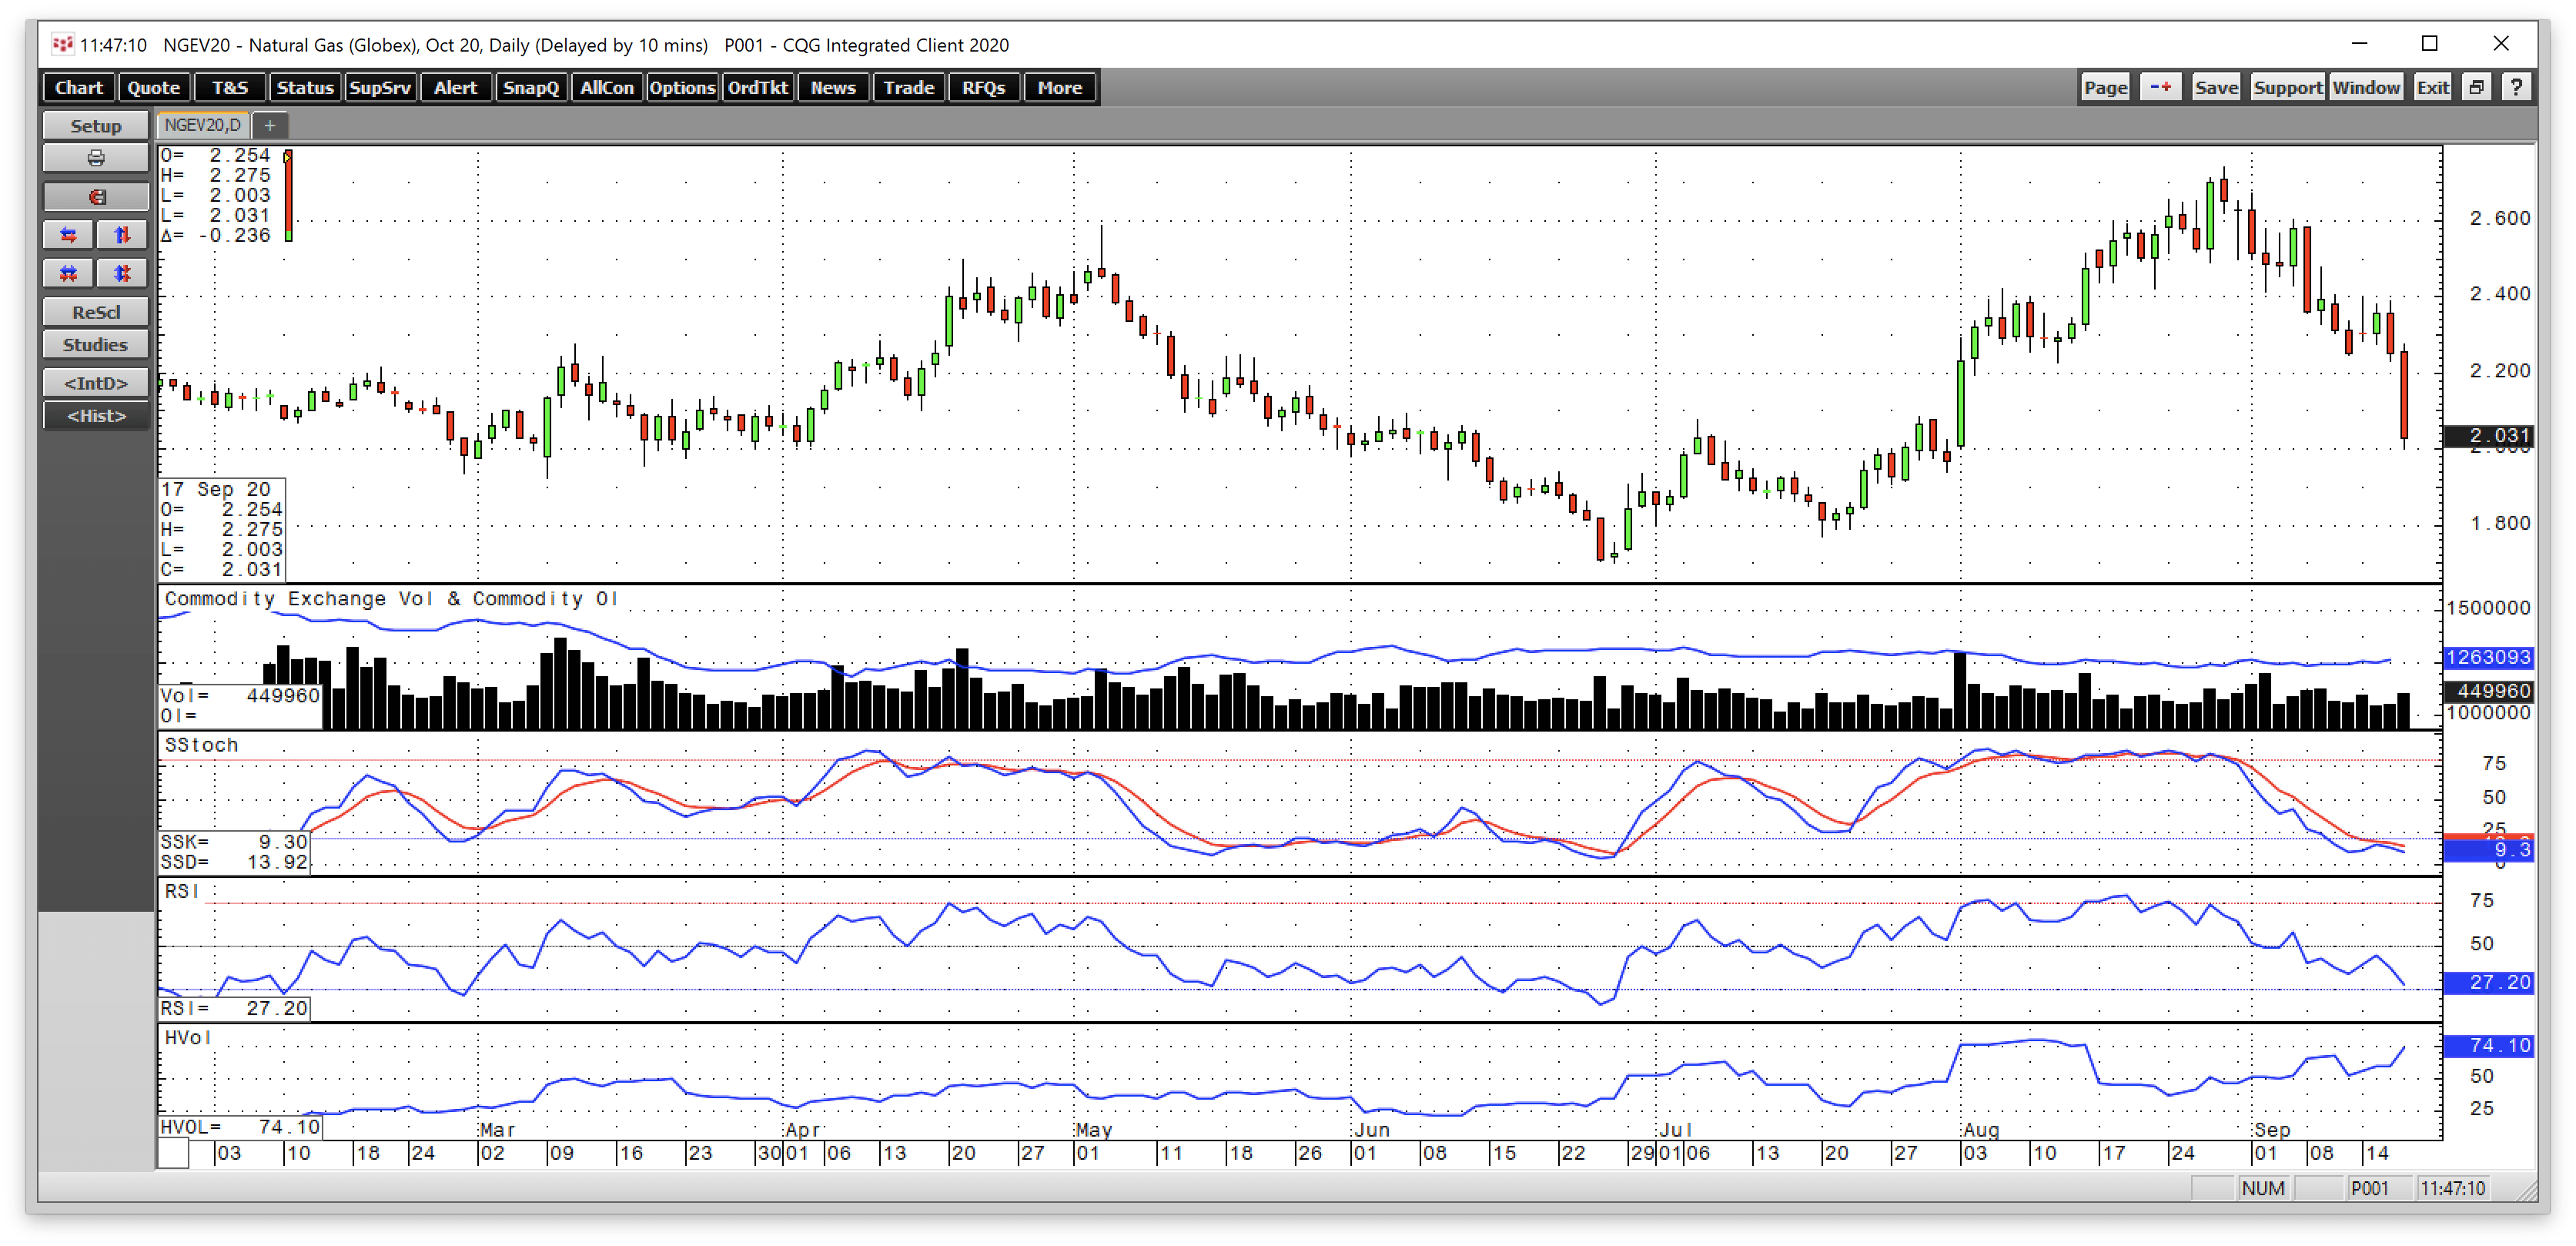
Source: CQG
As the daily chart shows, the price of nearby October NYMEX natural gas futures dropped to a low of $2.003 per MMBtu on September 17 after the latest EIA data. The low was the same as on August 3. Time will tell if the low becomes a double bottom or a gateway to another move below $2 on the October contract.
The total number of open long and short positions has been steady between the 1.23 and 1.31 million contract level since early July. The price decline since late August pushed price momentum and relative strength indicators into oversold territory on the daily chart. Daily historical volatility spiked to the 75% level on September 17 as natural gas took the elevator to the downside.
The hurricane season has caused lots of volatility
Since late August, a pair of hurricanes in the Gulf of Mexico provided support for the natural gas futures market. Hurricane Laura made landfall in late August, which likely pushed the price to the high at $2.743 on August 28. The delivery point for NYMEX natural gas futures is the Henry Hub in Erath, Louisiana, not far from the Gulf of Mexico.
Last week, the approach of Hurricane Sally likely kept the price between $2.30 and $2.40. After the storm passed, and the EIA reported inventory data that increases the potential of a new record high in inventories for the 2020/2021 peak season, the price dropped back to $2 per MMBtu. We are still at the time of the year where other storms could increase price variance in the natural gas futures market. Moreover, we are coming up on the beginning of the 2020/2021 withdrawal season in approximately nine weeks. The price of natural gas for delivery in January 2021 was trading at over $3.20 per MMBtu on September 17, a 60% premium to October futures.
Further complicating matters, the November 3 election in the US is a referendum on the future of fracking and energy production. Therefore, price volatility in the natural gas futures arena is likely to be the norm rather than the exception over the coming weeks and months.
The November 2019 high stands as critical resistance- Trading natural gas with BOIL and KOLD
Those who follow my articles on Seeking Alpha know that I had been bearish on the price when it was rising to the late August high. I remained bearish in my latest piece on Seeking Alpha on September 14 but said that I would be “looking for long-side opportunities at lower levels.”
At the $2 level, risk-reward could now favor the upside, but I would only approach the market with a tight stop in the current environment. I will be trading natural gas from flat to long over the coming days.
The most direct route for a risk position is via the futures and futures options that trade on the CME’s NYMEX division. For those looking to participate in the market using standard equity accounts, the ProShares Ultra Bloomberg Natural Gas product (BOIL) and its bearish counterpart (KOLD) provide an alternative.
The price of October natural gas futures dropped from $2.743 on August 28 to $2.003 per MMBtu on September 17 or 26.98%.
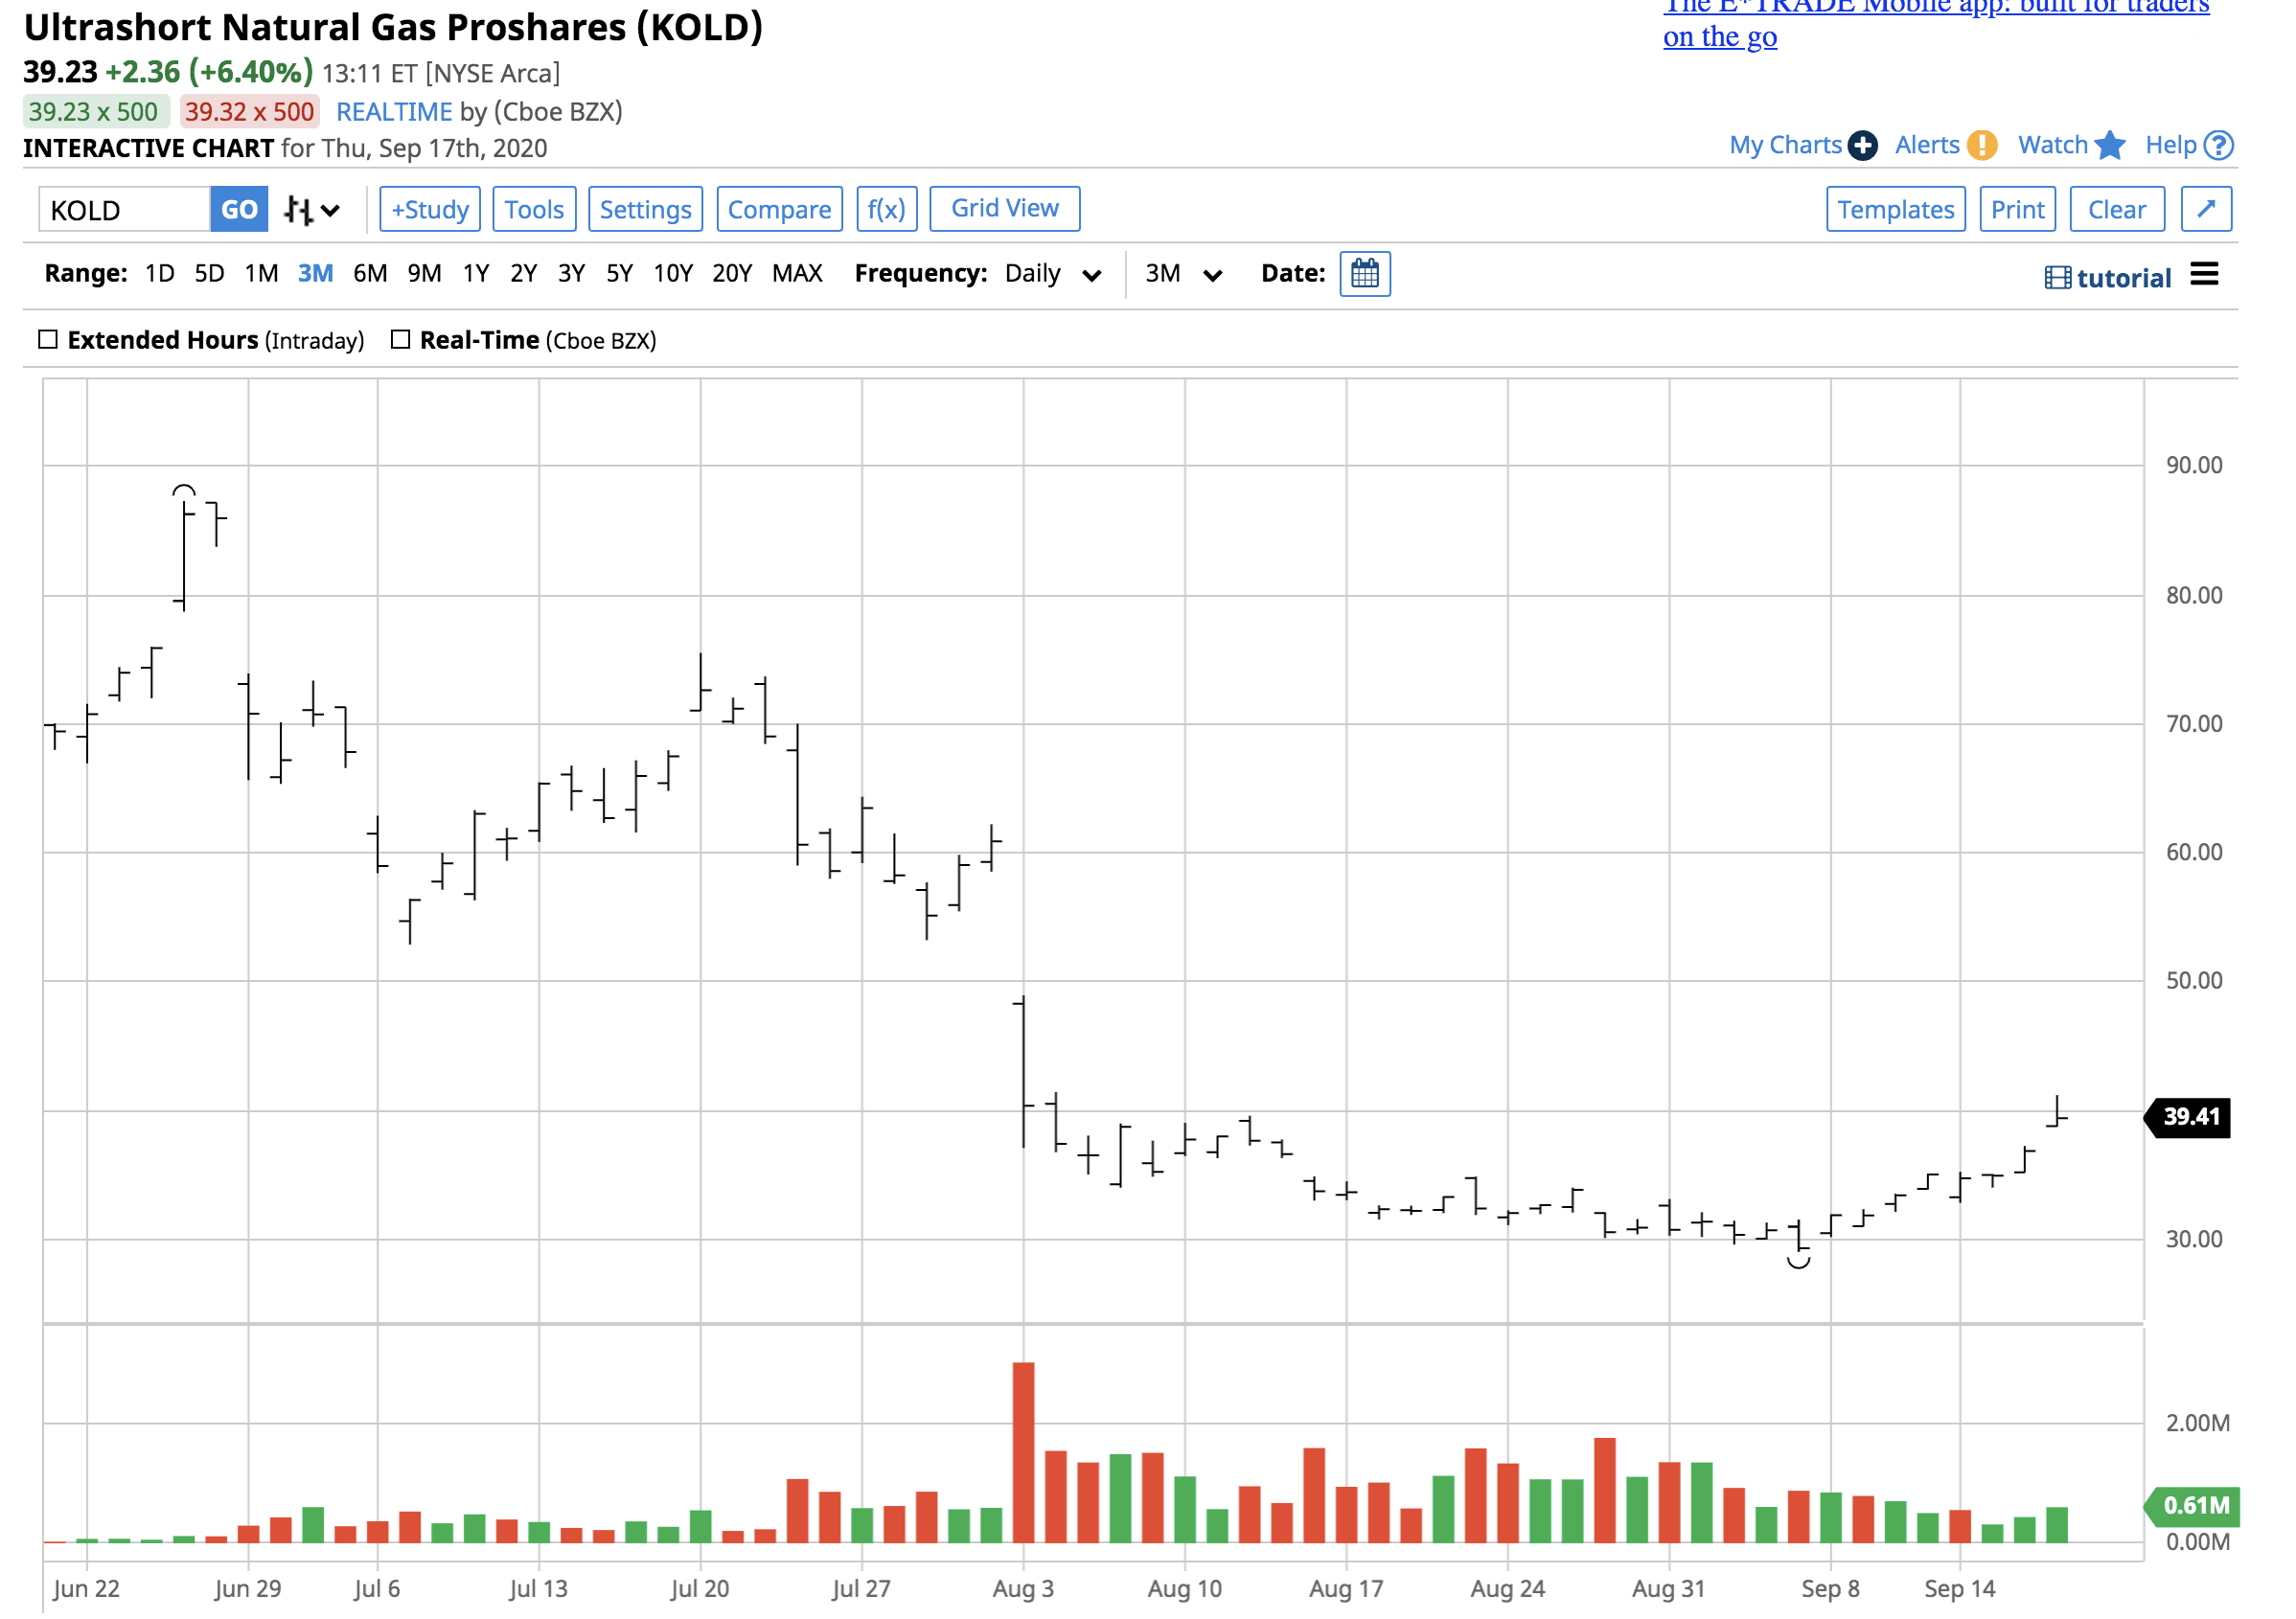
Source: Barchart
Over the same period, KOLD rose from $30.40 to $41.20 per share or 35.5%. The product failed to deliver double leverage compared to the price of October futures during the price correction. KOLD has net assets of $25.19 million, trades an average of 732,057 shares each day, and charges a 1.54% expense ratio.
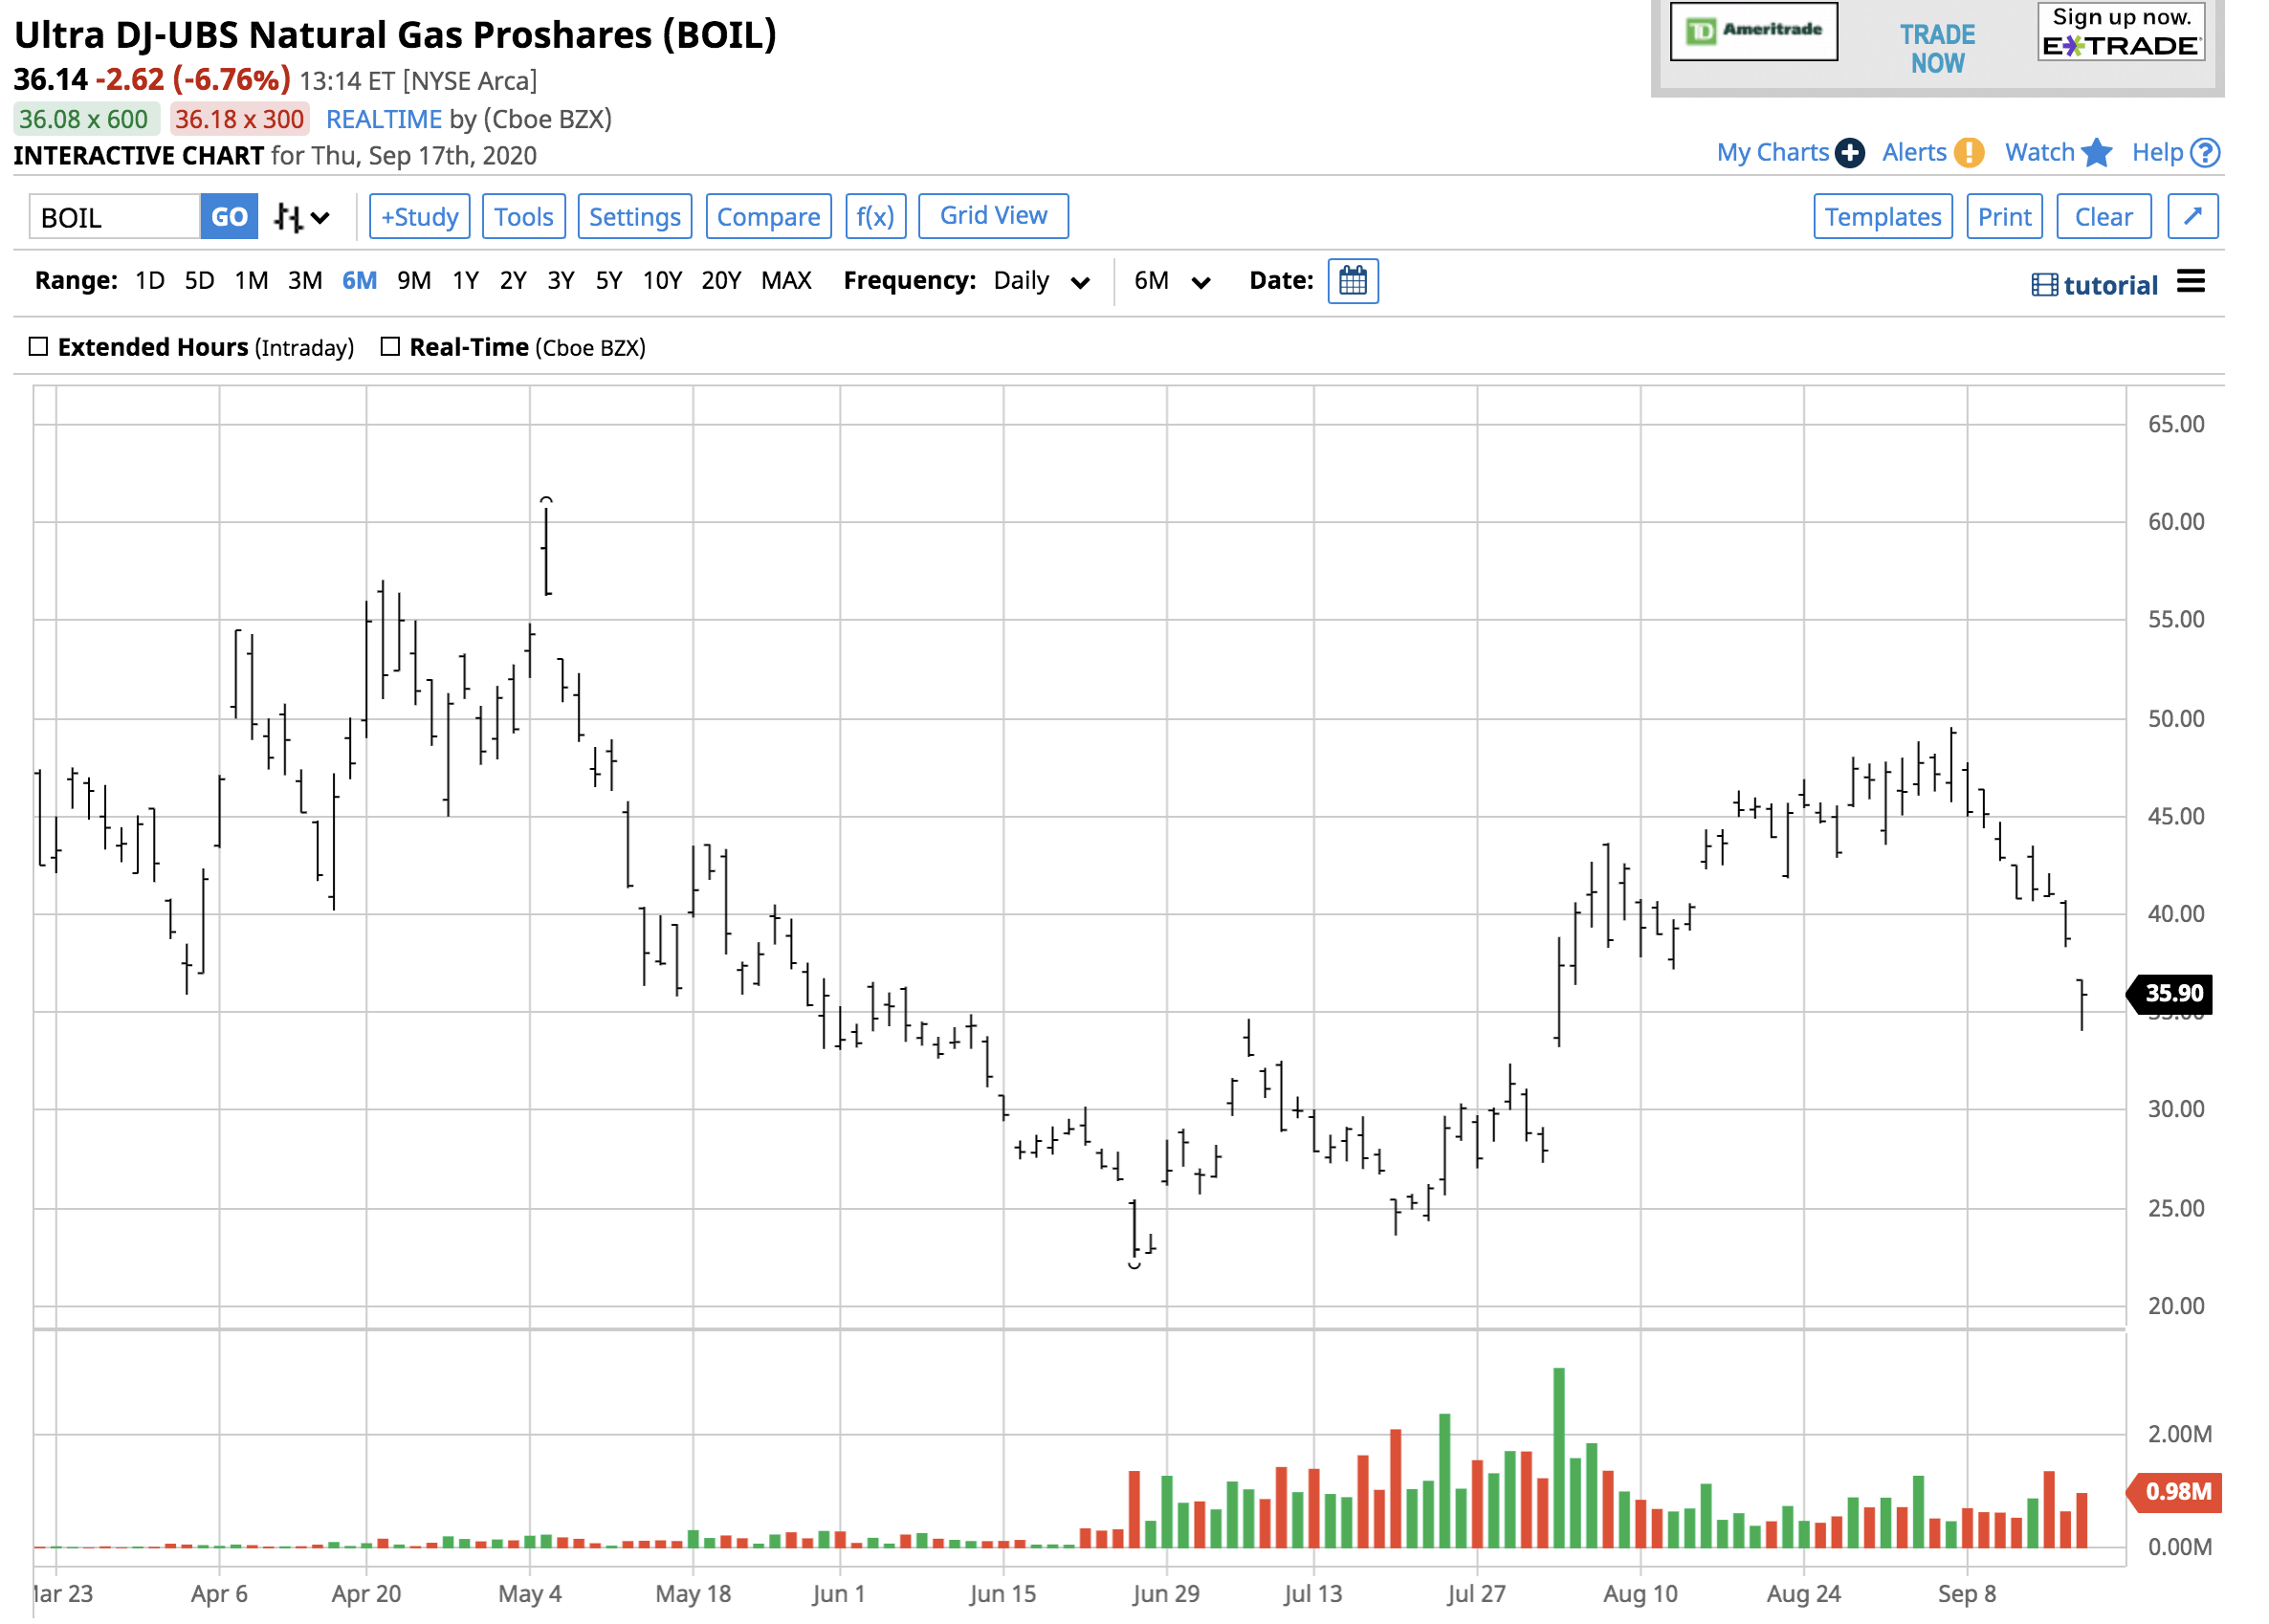
The long-side product, BOIL, also missed the target when it comes to double leverage when natural gas rallied from the late June low to the high in late August.
Source: Barchart
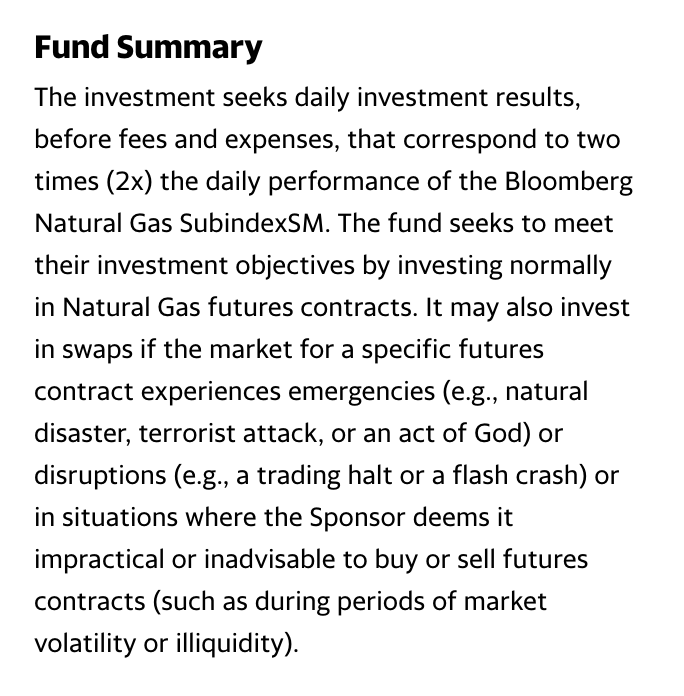
The chart shows that BOIL rose from $22.50 to $49.55 per share or 120.2% during the period that natural gas prices moved higher. BOIL has net assets of $50.6 million, trades an average of 965,868 shares each day, and charges a 1.31% expense ratio. BOIL’s fund summary states:
Source: Yahoo Finance
KOLD operates inversely as it seeks to return twice the price action in natural gas on the downside. Both products hold positions in NYMEX natural gas futures to create leverage. Both returned only around 1.3 times the price moves from late June through late August in the case of BOIL, and from late August until September 17 when it comes to KOLD. Since the products are leveraged, time value could explain at least some of the product’s underperformance.
I prefer the natural gas futures market when it comes to risk positions. However, when looking for leverage in the ETF/ETN arena, BOIL and KOLD are the only games in town since UGAZ and DGAZ faded into obscurity.
The Hecht Commodity Report is one of the most comprehensive commodities reports available today from the #2 ranked author in both commodities and precious metals. My weekly report covers the market movements of 20 different commodities and provides bullish, bearish and neutral calls; directional trading recommendations, and actionable ideas for traders. I just reworked the report to make it very actionable!
Disclosure: I/we have no positions in any stocks mentioned, and no plans to initiate any positions within the next 72 hours. I wrote this article myself, and it expresses my own opinions. I am not receiving compensation for it (other than from Seeking Alpha). I have no business relationship with any company whose stock is mentioned in this article.
Additional disclosure: The author always has positions in commodities markets in futures, options, ETF/ETN products, and commodity equities. These long and short positions tend to change on an intraday basis.
Recent Comments