
Toward the end of the last Ice Age, as mile-thick glaciers weighed down the land surface and then melted, parts of New England and eastern Canada became inundated by water. Some lowlands flooded and formed inland basins like the Champlain Sea.
Ten thousand years later, with seas now rising because of global warming, scientists are combing through an array of data and building increasingly detailed models to understand the processes that drive regional and local changes in sea level. The goal is to project when, where, and how much seas are likely to rise in the coming decades and centuries. It’s an incredibly complicated set of interdependent calculations.
“People tend to think that sea level is like a bathtub with the water level simply rising and falling depending on how much water is coming out of the faucet,” said paleoclimatologist Anders Carlson of the Oregon Glaciers Institute. “In reality, it’s more like a spinning bathtub that’s changing shape, moving up and down, and has water pouring into and out of different drains and over the sides. Where the water will ultimately slosh over the edge of the tub is influenced by many things, making it difficult to say where the overtopping will occur.”
Despite the complexities, the scientific understanding of the factors that control sea level has improved dramatically in recent decades, as have measurements of past sea level change and projections of future change.
“We can tell you how much the ocean has warmed in recent decades, and how much more space the water takes up. We have satellites and other tools that have measured that,” said Ben Hamlington, the current lead of NASA’s sea level change team. “The same thing is true for several of other factors that influence sea level, such as the mass of the ocean, the salinity, and how much water is stored on land.”
That growing knowledge base is why scientific organizations like the Intergovernmental Panel on Climate Change (IPCC) are publishing sea level rise projections with increasing levels of confidence. In its 2019 report, the IPCC projected (chart above) 0.6 to 1.1 meters (1 to 3 feet) of global sea level rise by 2100 (or about 15 millimeters per year) if greenhouse gas emissions remain at high rates (RCP8.5). By 2300, seas could stand as much as 5 meters higher under the worst-case scenario. If countries do cut their emissions significantly (RCP2.6), the IPCC expects 0.3 to 0.6 meters of sea level rise by 2100.
A host of competing factors will influence how global sea changes translate to regional and local scales. Among them: the rising or falling of the land surface due to plate tectonics and human activity; gravity anomalies that can create regional bulges and dips in sea surface height; variations in the temperature and salinity of seawater; changes in the amount of water stored on land in reservoirs; isostatic adjustment due to the addition, loss, and movement of land ice; and changes in erosion and how much sediment rivers carry to coastal areas.
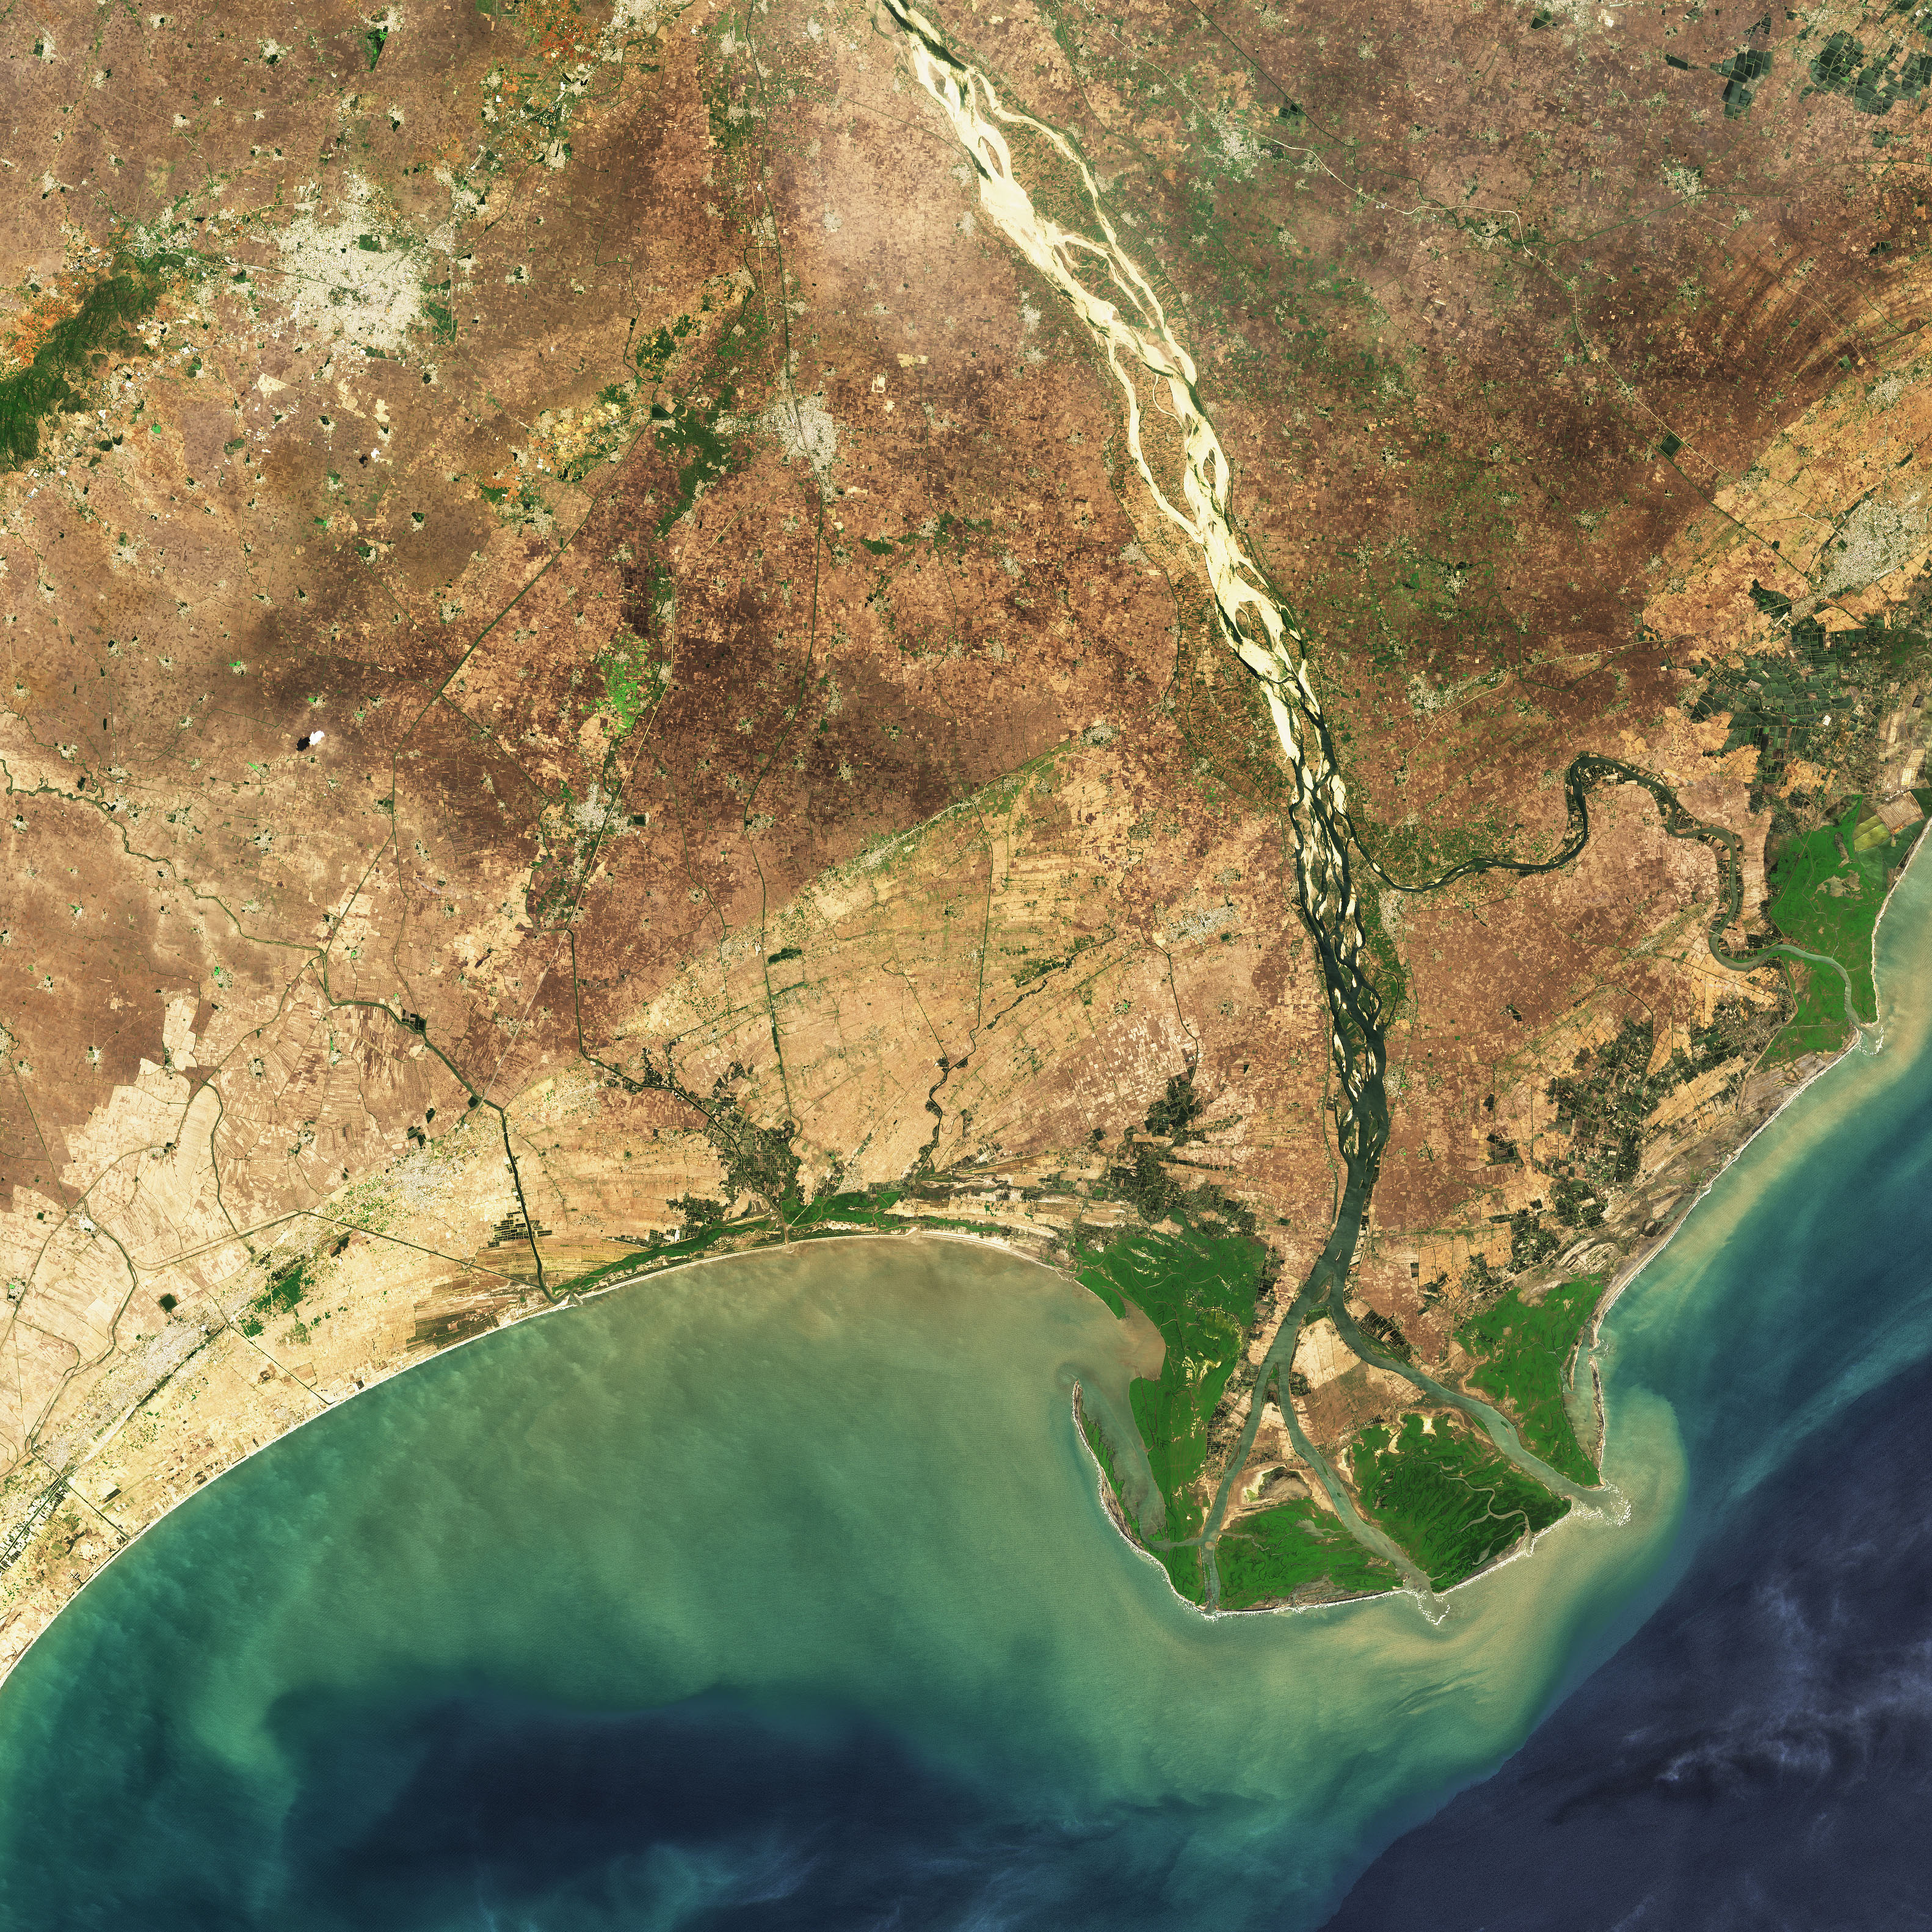
Sorting out how river deltas will respond is a particularly thorny and consequential issue. Tens of millions of people live on river deltas around the world (such as India’s Krishna Delta, shown above), and many of them are subsiding (sinking), often at twice the mean rate of sea level rise. The subsidence is due to a combination of factors like the natural settling of sediments, groundwater and oil extraction, and the extra weight of buildings. Inland dam construction and land management practices can also starve deltas of the raw material needed to replenish and build coastal land.
But it is hard to predict human settlement patterns—and the subsidence it causes—decades or centuries from now. Many IPCC projections do not even attempt to incorporate estimates of this subsidence partly because of the uncertainties in future land use and human behavior and because there is a lack of readily available, large-scale data on vertical land motion to feed into models of sea level rise.
The current shortage of land motion data is poised to become an abundance with the launch of the NASA-ISRO Synthetic Aperture Radar (NISAR) mission in 2022. The radar will make daily, global measurements of land motion that sea level experts like Manoochehr Shirzaei of Virginia Tech say will lead to major improvements in regional sea level rise projections.

Likewise, teams of scientists have been surveying the fast-sinking Mississippi River Delta to get a better understanding of how changes in sediment and vegetation affect the delta. Scientists participating in NASA’s Delta-X campaign have collected several types of data to develop and calibrate a model of how the delta might respond to rising sea levels in the next century.
“The combination of anthropogenic subsidence and increasing rates of sea level rise is a five-alarm fire for many delta cities,” said Shirzaei. “Places like New Orleans, Kolkata, Yangon, Bangkok, Ho Chi Min City, and Jakarta will undoubtedly face increasing pressures from flooding and saltwater intrusion.”
Still, the long-term picture—hundreds of years into the future—is unlikely to be perfectly clear. “When you think about future impacts of sea level rise, you also have to consider what people might do in response,” said Hamlington. Some countries—like The Netherlands and the United States—have already built elaborate sea walls and water-control systems that protect vulnerable deltas like the Rhine and the Sacramento-San Joaquin. They will likely continue reinforcing these systems as sea levels rise. In others deltas, like the Krishna (shown above) or Ganges in India, the Chao Phraya in Thailand, and the Mekong in Vietnam, coastal defenses are more limited so far.
“The reason people within the scientific community are working so hard on regional sea level rise projections is that if we can get them right, it will give cities and nations a chance to prepare,” said Hamlington. “Even if some of the more distant projections are inexact, they still provide critical constraints that could end up being the difference between places that successfully adapt to rising seas and those that experience the most damaging consequences.”
NASA Earth Observatory images by Joshua Stevens, using Landsat data from the U.S. Geological Survey and sea level rise projections courtesy of Benjamin Hamlington/NASA/JPL-Caltech. Story by Adam Voiland.
Recent Comments