This article is written for those who want to get better at using price to earnings ratios (P/E ratios). We’ll show how you can use The Warehouse Group Limited’s (NZSE:WHS) P/E ratio to inform your assessment of the investment opportunity. What is Warehouse Group’s P/E ratio? Well, based on the last twelve months it is 14.36. That means that at current prices, buyers pay NZ$14.36 for every NZ$1 in trailing yearly profits.
View our latest analysis for Warehouse Group
How Do I Calculate A Price To Earnings Ratio?
The formula for price to earnings is:
Price to Earnings Ratio = Share Price ÷ Earnings per Share (EPS)
Or for Warehouse Group:
P/E of 14.36 = NZD2.80 ÷ NZD0.19 (Based on the year to July 2019.)
Is A High Price-to-Earnings Ratio Good?
A higher P/E ratio means that investors are paying a higher price for each NZD1 of company earnings. That isn’t necessarily good or bad, but a high P/E implies relatively high expectations of what a company can achieve in the future.
How Does Warehouse Group’s P/E Ratio Compare To Its Peers?
One good way to get a quick read on what market participants expect of a company is to look at its P/E ratio. The image below shows that Warehouse Group has a lower P/E than the average (17.4) P/E for companies in the multiline retail industry.
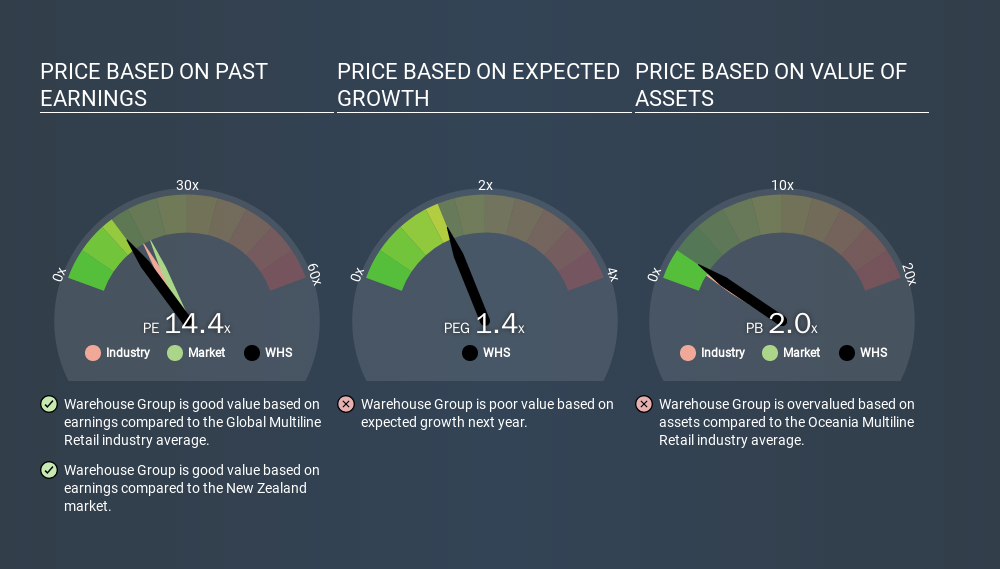
This suggests that market participants think Warehouse Group will underperform other companies in its industry. Many investors like to buy stocks when the market is pessimistic about their prospects. You should delve deeper. I like to check if company insiders have been buying or selling.
How Growth Rates Impact P/E Ratios
If earnings fall then in the future the ‘E’ will be lower. Therefore, even if you pay a low multiple of earnings now, that multiple will become higher in the future. So while a stock may look cheap based on past earnings, it could be expensive based on future earnings.
In the last year, Warehouse Group grew EPS like Taylor Swift grew her fan base back in 2010; the 145% gain was both fast and well deserved. Unfortunately, earnings per share are down 4.3% a year, over 5 years.
Remember: P/E Ratios Don’t Consider The Balance Sheet
It’s important to note that the P/E ratio considers the market capitalization, not the enterprise value. In other words, it does not consider any debt or cash that the company may have on the balance sheet. Theoretically, a business can improve its earnings (and produce a lower P/E in the future) by investing in growth. That means taking on debt (or spending its cash).
Such expenditure might be good or bad, in the long term, but the point here is that the balance sheet is not reflected by this ratio.
Is Debt Impacting Warehouse Group’s P/E?
Net debt totals just 8.6% of Warehouse Group’s market cap. It would probably trade on a higher P/E ratio if it had a lot of cash, but I doubt it is having a big impact.
The Bottom Line On Warehouse Group’s P/E Ratio
Warehouse Group trades on a P/E ratio of 14.4, which is below the NZ market average of 19.6. The company hasn’t stretched its balance sheet, and earnings growth was good last year. If the company can continue to grow earnings, then the current P/E may be unjustifiably low.
Investors should be looking to buy stocks that the market is wrong about. If it is underestimating a company, investors can make money by buying and holding the shares until the market corrects itself. So this free visualization of the analyst consensus on future earnings could help you make the right decision about whether to buy, sell, or hold.
You might be able to find a better buy than Warehouse Group. If you want a selection of possible winners, check out this free list of interesting companies that trade on a P/E below 20 (but have proven they can grow earnings).
If you spot an error that warrants correction, please contact the editor at [email protected]. This article by Simply Wall St is general in nature. It does not constitute a recommendation to buy or sell any stock, and does not take account of your objectives, or your financial situation. Simply Wall St has no position in the stocks mentioned.
We aim to bring you long-term focused research analysis driven by fundamental data. Note that our analysis may not factor in the latest price-sensitive company announcements or qualitative material. Thank you for reading.

The easiest way to discover new investment ideas
Save hours of research when discovering your next investment with Simply Wall St. Looking for companies potentially undervalued based on their future cash flows? Or maybe you’re looking for sustainable dividend payers or high growth potential stocks. Customise your search to easily find new investment opportunities that match your investment goals. And the best thing about it? It’s FREE. Click here to learn more.
Recent Comments