

There are often tough lessons to be learned when investing in exploration and production (“E&P”) companies. Near universally, I find E&P management teams tend to overpromise, underdeliver, or obfuscate results – and while arguably all senior executives tend to do try to put the bull case forward for their companies, I think energy, in particular, toes a very fine line that borders on abuse. Ring Energy (REI) is a poster child for that, and I wanted to expand on these issues (along with recently given 2020 spend guidance) to illustrate. While I suspect I’ll get the usual cheerleading from recent longs considering the shares are up incrementally from my last bearish take (“Ring Energy: Pitfalls of E&P Investing”), remember that this is not a Short recommendation. Instead, it’s a piece meant to highlight some of the issues with the firm, something that I’ll carry forward today.
Fuzzy Math, Questionable Breakevens
First, I want to call out an excellent research note published by Elephant Analytics on Ring Energy back in the middle of January. Many of the themes I will explore with the company today were also hit on well there, particularly non-drilling and completion capital expenditure requirements and other miscellaneous booked expenses that continue to hit consolidated results. Unfortunately, many investors have gotten burned on Ring Energy, neglecting to square up the math versus actual financial results.
As a reminder, Ring Energy is a “conventional” producer, primarily drilling traditional vertical wells versus horizontal. Its producing acreage lies in the San Andres, an area that benefits from high oil cuts and shallower wells that are not as expensive or as complicated to drill versus unconventional. I think that investment pitch appeals to many of the cost-conscious investors out there that view the rise and proliferation of unconventional shale production as analagous to having given a teenager a credit card, as many shale producers have grown production materially without generating much shareholder value.
But there are caveats. The flip side of that cost equation is relatively weak estimated ultimate recoveries (“EURs”) and initial production (“IP”) from conventional wells. For instance, in its most recent investor update, Ring Energy noted that wells drilled in Q4 2019 saw IPs of 504 boe/d, or a little more than 100 boe/d per 1,000 foot of lateral length. Producers like EOG Resources (EOG) are getting between 2,000 boe/d and 3,000 boe/d on laterals between 5,000 feet and 7,000 feet in the Permian (just a hair longer) via unconventional production in the Delaware Basin in Wolfcamp and Bone Spring. Nationwide, 35% of all wells brought into production in 2019 saw IP rates double that of what Ring Energy is realizing on average. Since these better wells make up a larger share of production, the majority of oil and natural gas produced domestically is coming from stronger wells. The company is just a below-average operator, and while there are cost advantages, they are mostly negated by weak oil recoveries.

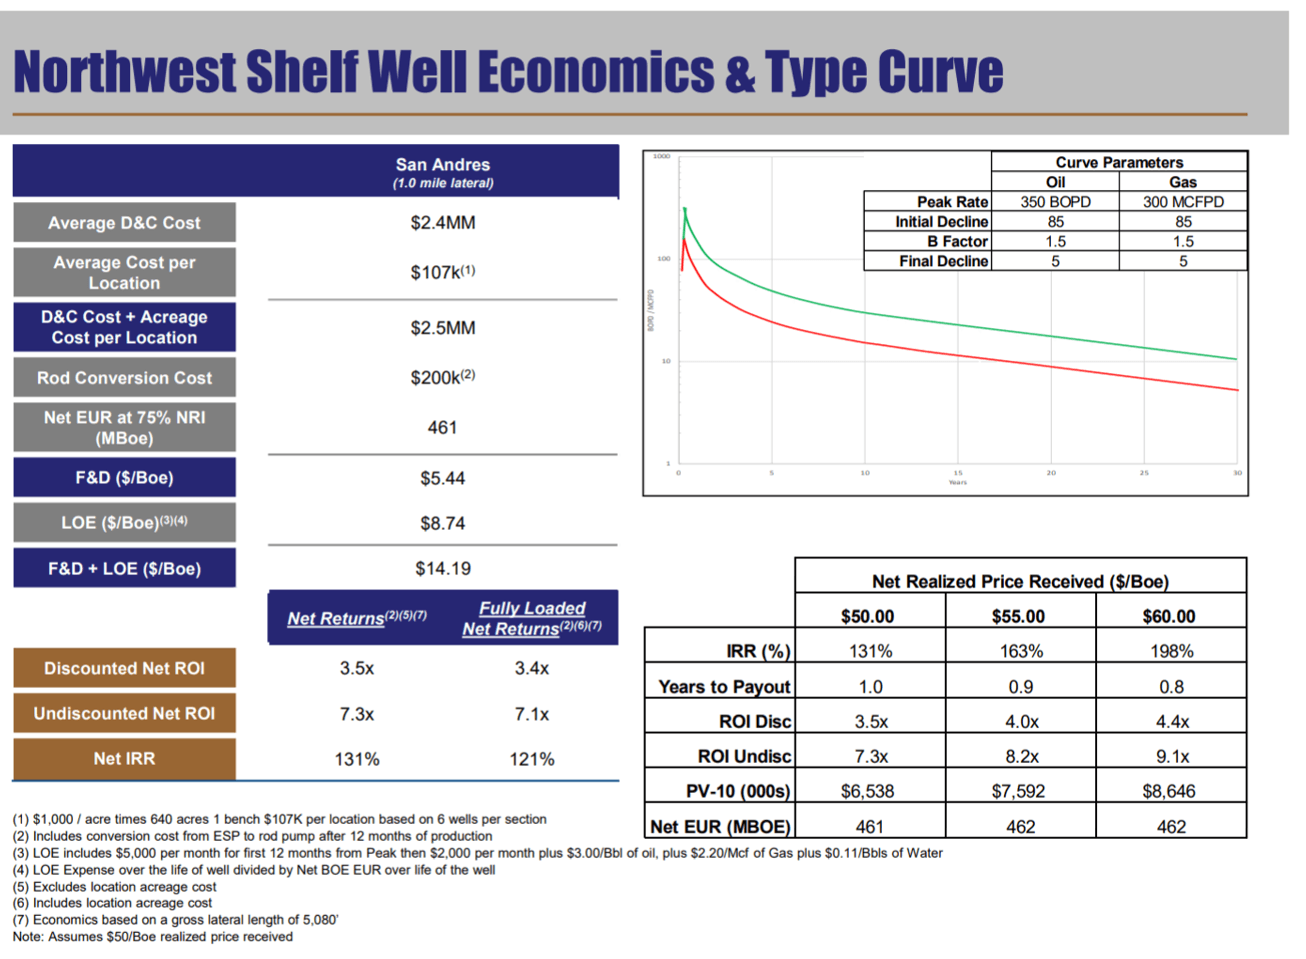
*Source: Ring Energy, January 2020 Investor Update, Slide 14
Ring Energy would tell you a different story. Within its Northwest Shelf asset, the company claims total finding and development (“F&D”) costs of $5.44/boe and lease operating expenses (“LOE”) of $8.74/boe, pointing to costs somewhere in the teens per barrel. This leads to internal rates of return (“IRRs”) of 131% at $50.00/barrel West Texas Intermediate (“WTI”) with very short payback times.
Any company earning IRRs like that should be printing money. Yet, year to date in 2019, Ring Energy has booked $62.5 million in operating cash flow against $122 million in capital spending (excluding acquisitions), which will not change in Q4. That means one thing: cash burn. While cash burn is fine for a growing company, all that spend has not produced any material production growth. Pro forma for the Wishbone acquisition (in which the company acquired the Northwest Shelf acreage position), production actually fell incrementally through the year: 11,667 boe/d in Q1 to 11,405 boe/d in Q4. In setting its 2020 objectives, the company planned $88 million of spend to drive flat year-over-year growth, essentially downshifting into maintenance mode (Source: Ring Energy, January 2020 Investor Update, Slide 23). That is tough to reconcile against a company that is supposedly sitting on top tier holdings.
While Ring Energy plans to “drill out of cash flow” in 2020, meaning that it will generate enough operating cash flow to fund that $88 million in capex budget, this means that the company is still not generating economic profit, while not growing production. That is a problem. On one hand, you have management trying to spin a story of having one of the best breakevens of any oil and gas operator with 100%+ IRRs, yet on the other, Ring Energy cannot generate free cash flow at a maintenance rate even with WTI in the $50s, a level where plenty of shale operators can. As an example, Range Resources Corp. (RRC) claims IRRs at half the level at $3.00/mmbtu natural gas.

*Source: Range Resources Corp., Capital One Presentation, Slide 19
Despite the fall in natural gas prices, Range Resources has proven its ability to generate free cash flow in 2019 at maintenance levels. It has guided to free cash flow in 2020, even with natural gas pricing in the proverbial toilet. So, how can an E&P like Range Resources generate free cash flow at 45% IRRs (arguably worse now given strip pricing), while another cannot while claiming IRRs at 131%?
A multitude of reasons. A big reason is non-drilling and completion capital expenditures, such as converting from electronic submersible pumps (“ESPs”) to rod pumps, infrastructure improvement (electrical, well casings), workovers, and supporting infrastructure like compressors. As Elephant Analytics stated in his research note I mentioned earlier:
That would leave around $72 million [for 2019] in non-D&C capex for items such as the reworking and upgrading of existing wells, and infrastructure improvements… [when considering 2018] thus, around $74 million may have been non-D&C capex in 2018 (not including leasehold acquisitions).
I think overall well costs are a bit higher, but the point still stands that Ring Energy will have spent $60-70 million in 2019 on non-D&C capital expenditures in 2019, has a history of a similar rate in 2018, and has guided to $35 million more in 2020 (inclusive of the rod conversion program) without driving a single barrel of increased pro forma production for over two years. All these exclusions are amazing. For most producers, non-D&C capital expenditures is about 15% of the overall spending budget; Ring Energy has that number at between 40% and 55% in recent years. Because these figures are left off IRR calculations slides like the one above, the company is able to report significantly higher IRRs than peers via gamesmanship with the numbers.
Non-D&C capital expenditures is not the only issue; general and administrative (“G&A”) costs is another. In 2019, G&A at Ring Energy will ring the cash register at $24 million, or roughly 13% of revenue. This is nearly $5.50 per barrel of energy produced. While there are only a few independent E&Ps out there of similar size, investors can look towards names like Whiting Petroleum (WLL) ($370 million market cap) or Laredo Petroleum (LPI) ($403 million market cap) that books G&A expense of 8% of revenue, a pretty material improvement from Ring Energy. Mid- to large-cap E&Ps are much better than this, with most booking G&A at less than 3% of revenue.
A lack of economies of scale is already a massive problem for small scale producers, and Ring Energy is among the worst. Scale matters. And (surprise surprise) just like non-D&C capital expenditures, G&A is excluded from well profitability calculations.
Takeaways
Some of this weakness should be common sense and really just should not pass the sniff test. Why on earth would a firm that could truly earn 100%+ IRRs be cutting spending heading into 2020, slashing both expected well completions and its projected capital spend by nearly half? It wouldn’t. Investors should take that a step further and ask why a management team which spent years trumpeting the value of its Central Basin Platform assets has now suddenly shifted to drilling zero new wells on its old acreage in favor of new holdings it has recently acquired (Wishbone / Northwest Shelf)?
Are most E&Ps undervalued? I believe so. There are deals to be had all over the space, but given the lack of profitability and scale here, the upside case at Ring Energy revolves around being taken out by a larger producer in an environment where 1) capital is tight and 2) conventional shale is out of favor. There are a lot better plays out there.
Are you an investor looking for sustainable high income? The energy sector is filled with opportunities to do just that. At Energy Income Authority, the focus is on finding high quality companies with the asset footprints necessary to throw off dividends for years to come.
Tired of lackluster coverage that barely breaks the surface? Deep dive analysis forms the cornerstone of the platform. Hundreds of companies fall under the coverage universe, from pipelines to refiners to the producers themselves. Members receive actionable research to keep their portfolio thriving.
Sign up for a NO OBLIGATION FREE TRIAL today to find out more.
Disclosure: I/we have no positions in any stocks mentioned, and no plans to initiate any positions within the next 72 hours. I wrote this article myself, and it expresses my own opinions. I am not receiving compensation for it (other than from Seeking Alpha). I have no business relationship with any company whose stock is mentioned in this article.
Recent Comments