



Over the past 20 years, it has become clear that supply chain management is a critical contributor to a company’s financial performance. Financial performance, in turn, contributes to a company’s market capitalization, or the value that investors place on a company. (Market capitalization, or “market cap,” can be calculated by taking the number of shares issued by the company and multiplying them by the price of each share.) For more information, see the associated sidebar.
Can a case then be made that supply chain management is a strategic driver of market capitalization? And, if so, can we say that market cap leaders manage their supply chains differently than others? What sort of supply chain characteristics and mindset lead to market cap leadership? These are important questions for supply chain leaders and practitioners to understand, particularly as their roles grow in importance at the executive and board level of companies.
To answer these questions, I looked at the market capitalization and financial statements of more than 1,500 public companies across 20 industries and drew upon my own practical experience of having directly analyzed more than 100 companies over the past 30 years.
The analysis seems to show that supply chain performance can affect a company’s market capitalization. But at the same time, the results of the analysis raise questions about some commonly held beliefs regarding supply chain metrics, particularly inventory turns. This article looks at the results of the analysis, offers explanations for why some long-held beliefs need to be questioned, and presents the mindset that must be adopted in order to achieve market leadership.
Analysis information
To ensure the validity of my analysis, I chose to look at a large dataset (more than 1,500 companies operating across 20 industries).1
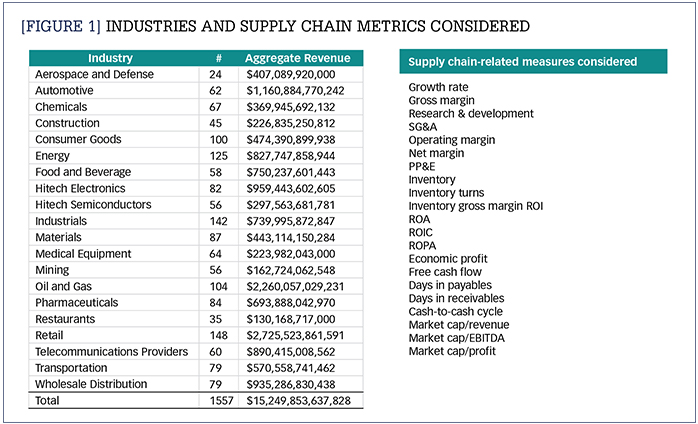
A summary of the dataset is shown in Figure 1. These companies represent more than $15 trillion of revenue and more than $10 trillion worth of economic activity, the equivalent of almost 50% of U.S. gross domestic product (GDP).2 The 1,500 companies carry around $1.6 trillion worth of inventory, which is more than half the inventory carried by the overall U.S. economy.3
 To compare the market capitalization for each company in our dataset, we used the measure “market cap multiple,” which is calculated by the following formula:
Market cap multiple = Market capitalization divided by Revenue
This has the effect of normalizing for company size.
The analysis isolated the top quartile of market cap multiple leaders in each industry and looked at their operational characteristics compared to the average performance of the industry in which they compete. For example, how do market cap leaders compare with industry averages in profitability, return on investment, and inventory turns? The analysis performed statistical correlations between market cap and different financial measures that relate to supply chain management. This includes operational measures—such as operating profit; net profit; earnings before interest, depreciation, taxes, and amortization (EBIDTA); cash flow; and inventory turns—along with return-on-investment measures such as return on assets (ROA), return on invested capital (ROIC), return on physical assets (ROPA), and economic profit. All financial information and associated measures were taken directly from public disclosures as found in the U.S. Securities and Exchange Commission’s Electronic Data Gathering, Analysis, and Retrieval database. This data was gathered for both the most recent fiscal year and for the past 10 fiscal years.
Below is a summary of the key findings:
- Across all industries, the measures that have the most dominant correlation to market cap leadership are all profitability-related, namely operating margin, net margin, and EBIDTA. Return on investment measures (ROA, ROIC, ROPA, and economic profit) are similarly correlated. However, inventory turnover—one of the most measured aspects of supply chain management—has no statistical correlation to market cap leadership. In fact, a high percentage of market leaders in all industries have lower than average inventory turns.
- The average market cap multiple for the top-quartile companies in each industry was found to be between 1.7 and 3 times more than the industry average and 5 to 7 times the average for laggards (defined as the lowest quartile).
- Market leaders spend significantly more on research and development, creating differentiated products that drive higher gross margins.
- Greater than 70% of market cap leaders were better than average in all forms of profitability, including operating income, net profit, and EBITDA.
- Greater than 70% of market cap leaders were better than average in all forms of return on investment, including ROA, ROIC, ROPA, and economic profit.
- 77% of market cap leaders were worse than average in inventory turns. Lower performance among leaders is true even after adjusting for gross margin differences.
These findings are examined in the sections that follow.
Financial basics
To assess company performance, we pulled information from three common financial statements: the income statement, the balance sheet, and the cash flow statement. The income statement summarizes profit by netting costs from revenue. The balance sheet reflects the input assets necessary for creating revenue and profit. The cash flow statement nets the amount of cash that flows into and out of the corporation during the period of the statement. In general, over the long term, a company’s market capitalization is based on revenue and profit (income statement), the level of assets (balance sheet) required to generate revenue and profit, and the amount of cash accumulated (cash flow statement).
Each financial statement contains elements related to supply chain management. These elements are highlighted in Figure 2. We analyzed more than 50 elements relating to cost, profitability, cash flow, and assets. These metrics included cost of goods sold (COGS); selling, general and administrative expense (SG&A); research and development (R&D); capital expenditure; inventory; receivables; payables; and property, plant, and equipment (PP&E).
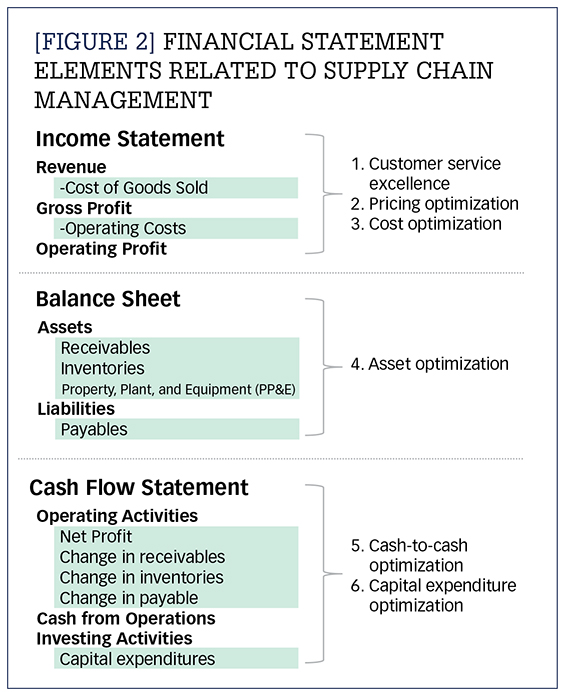
Much of the historical focus in supply chains has been on managing costs and assets. However, particularly in the past 10 years, the balance has shifted strongly towards customer service and profitability, including product and product variant choice, delivery choice and precision, and flexible returns.
Where do I find supply chain costs?
Figure 3 provides more detail on cost elements related to supply chain management and where they reside in a company’s income statement. However, income statements do not include the level of detail shown in Figure 3. Typically, they will include three cost line items: COGS, SG&A, and R&D (some companies include R&D costs as part of SG&A). Some companies include more detail in the notes section of their financial statements; however, there is no consistency on the level of detail provided. Amazon is an example of a company that provides good detail on their distribution and transportation costs, as well as capital expenditures for distribution centers.
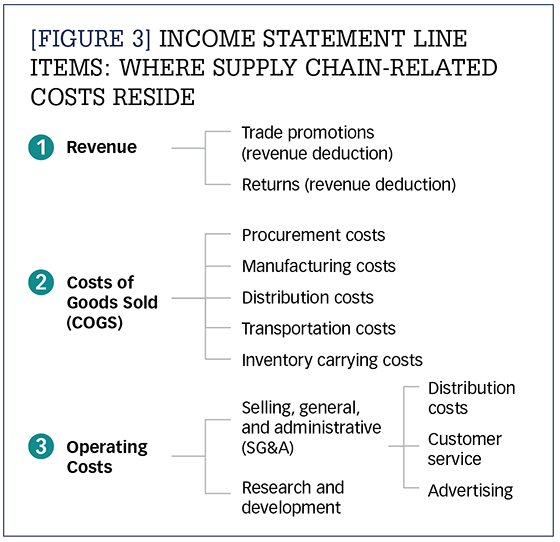
Most companies include all supply chain costs in COGS. (Some companies refer to COGS as “cost of sales.”) However, some companies tag distribution costs as operating costs in the selling, general, and administrative (SG&A) line item. For example, Target includes all its distribution costs in COGS, whereas Walmart includes the costs of operating itsdistribution centers in SG&A. These differences should be noted when making direct comparisons between companies.
SG&A typically includes advertising budgets and customer service operating costs. Trade promotions, pricing allowances, and returns are accounted for as deductions to revenue. While these are typically not directly under the control of supply chain management, they are significant drivers of demand and inventory. This is particularly true in heavily promoted product industries such as consumer goods and food and beverage.
Historically, supply chain management has focused almost exclusively on driving down the COGS elements shown in Figure 3. While this is still important, what has become more important in recent years is a focus on how supply chains can help drive revenue and market share. This assertion is borne out by those companies getting rewarded in the stock market, which is supported by information presented later in this article.
Return on investment
In addition to cost elements, our analysis also looked at ROI measurements. For more than a hundred years, companies have used various ROI measurements to determine how to allocate capital. Capital allocation is the process of determining where and how much to invest in different business opportunities. Three common ROI measures are return on assets (ROA), return on invested capital (ROIC), and economic profit (EP). ROA is simply the profit of a business divided by its total assets. ROIC is profit divided by total assets minus total liabilities. Economic profit is net profit minus the cost of capital. All of these measures are useful in comparing company performance, but each have limitations when comparing supply chains since they all include non-supply chain related elements.
Another ROI measurement that is gaining in popularity is return on physical assets (ROPA). The analysis firm Gartner, for example, recently switched from using ROA to ROPA for its annual ranking of the top 25 supply chains. While ROA shows the return on investment for all assets on a company’s balance sheet, ROPA shows the return on investment for only the physical assets on a company’s balance sheet. Physical assets include PP&E and inventories. ROPA more closely aligns to the purview of supply chain management since it only includes the physical assets over which supply chain managers have control.
This analysis included ROPA, along with the other previously discussed ROI measures. Results of the analysis show that market cap leaders perform equally well in all the ROI measures and significantly above their industry averages.
Market cap and inventory turns
Another area that we focused on in our analysis was inventory turns. Inventory is a physical manifestation of the work of supply chains. It is produced, transported, stocked, consumed, transformed, and ultimately sold and delivered to an end customer in the form of a finished product. Inventory turnover (turns) is probably the most discussed and reported inventory metric in supply chains. It represents how often a company consumes and sells its inventory in a given period (typically a year). For example, if inventory turns are eight, that means the company is buying inventory, transforming it, and shipping it out as sold products eight times every year. The standard equation is as follows:
Inventory Turns = COGS divided by Inventory
In this case, inventory is average inventory over the period for the calculation, typically a year. (Note: The analysis presented here used only inventory at the end of the period.) A company’s inventory turns can be calculated by simply taking the COGS number from the income statement and dividing it by the inventories number from the balance sheet.
Inventory represents cash that is tied up, since there is cash required to buy, transport, transform, stock, and distribute it. The more times inventory is turned over, the more times it is turned into cash. Most supply chain improvement projects over the years have had at least some focus on improving inventory turns. One of the common financial justifications for investment is improved cash flow through inventory reduction.
Conventional wisdom says that when it comes to inventory turns, more is always better. However, this analysis shows that those companies with a better market capitalization than their industry peers are more likely to perform worse than the industry average in inventory turns; in many cases, much worse. (Note: We also looked at the relationship between inventory turns and gross margin. Across all industries, there is a slight inverse relationship. Normalizing for this relationship does not impact the findings here.) Consider the table in Figure 4, which shows the inventory turn average for each market cap multiple quartile for six industries. For example, the first column (Q4) shows the average inventory turns for the market cap leaders; the fourth column (Q1) shows the average inventory turns for market cap laggards.
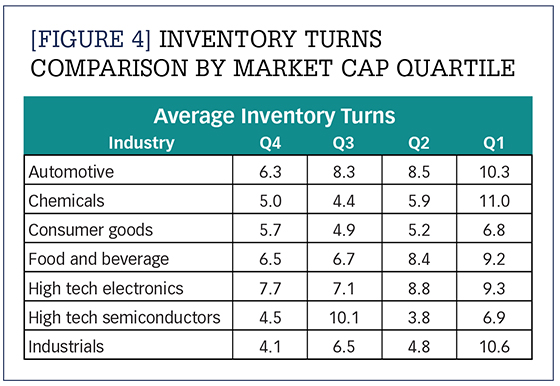
This analysis shows definitively that inventory turns are a poor indicator of corporate performance, at least insofar as relative market capitalization is concerned. Across all industries, 77% of market cap leaders are below average in inventory turns. Furthermore, among top-quartile market cap companies, only 20% are also in the top quartile in inventory turns within their industries.4
A statistical correlation also shows that market cap multiple and inventory turns have near zero correlation in almost all industries.
How do we explain this?
A strategic shift
As mentioned earlier in the article, there has been a shift in supply chain strategy over the last 10 years. Instead of focusing solely on containing costs and optimizing assets, more and more companies see their supply chain as a driver of customer satisfaction and profitability. The results from this analysis validate that this trend makes sense in terms of financial results and market capitalization. Over the years, supply chains have had to handle an increasing number of products, product variants, and delivery methods. A singular focus on cost in this type of environment is likely to be not just suboptimal but also strategically damaging. Market laggards may perform better in inventory turns simply because that is all they are focused on.
Market leaders also invest significantly more in research and development, creating differentiated products with higher gross margins. They then use their supply chains to enhance those gross margins by providing differentiated service. Supply chains and the service they provide become a significant part of the value proposition of the product. They do this not just to be cost competitive, but also because they want to figure out how to leverage assets (PP&E and inventory) to provide a superior service value proposition to customers. This represents a shift from a cost mindset to a profit mindset.
Supply chain management is now a complex science of trade-offs, which requires decisions that continuously align with company strategy. That strategy may be a combination of revenue, market share, profit, and ROI goals, and it may differ at the intersection of product, geography, customer, and time. Those companies that make these trade-offs most effectively and most rapidly are able to continuously take advantage of market opportunities and deliver revenue, while also delivering a reasonable return on investment. Conversely, those companies that relegate their supply chains to cost management tend strongly to be market share losers and by extension, market cap laggards.
Results of this analysis show a clear leadership trend away from a cost-center mentality towards a profit-centermentality. It may be difficult to think of the supply chain as a profit center, but when you think of leaders in various industries—Amazon, Procter & Gamble, Hershey, Honeywell, Cisco, Texas Instruments, Merck, McDonalds, UPS, and WW Grainger, to name just a few—it is easy to see that their supply chains have become part and parcel to their products and services, and by extension an integral part of their brands.
Leadership today is characterized by personalized customer service that is enabled by dynamic supply chain segmentation and agility in decision making and operations. Leaders are increasingly exhibiting profit-center characteristics, which are shown in Figure 5.
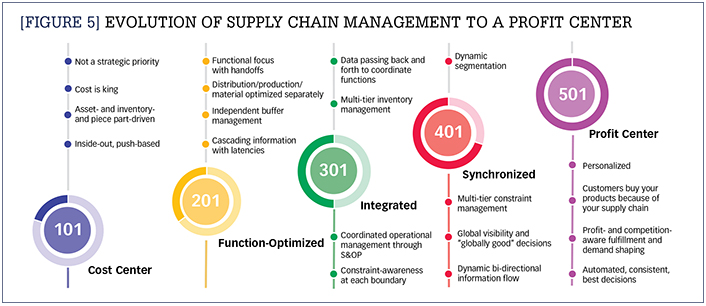
The coronavirus pandemic has exposed some of the fragility of highly granular product and customer segmentation and has resulted in stock-keeping unit (SKU)-count reductions and operation consolidations. This development is likely to result in some slowing down or reversal of recent trends. However, the long-term trend for supply chain leadership continues to be a finely tuned customer response that is also profit- and ROI-aware. Those companies that make decisions and execute in alignment with these principles are also likely be rewarded with market cap leadership.
Notes:
1. The analysis was limited to public companies with greater than $200 million in revenue in each industry. I sourced the company financial data from the U.S. Securities and Exchange Commission (SEC) Electronic Data Gathering, Analysis, and Retrieval (EDGAR) database, via Calcbench.com. The analysis used financial data for the most recent fiscal year for each company, as of September 2020. The sources for market cap information are Yahoo Finance and Refinitiv and are based on market capitalizations as of September 2020. Companies are limited to those that report results in the United States. This includes some non-U.S. companies. It’s important to note that large companies have global revenue streams, so comparisons to U.S. gross domestic product and inventory numbers are for scale contrast only.
2. Economic activity is an estimate of the value add of each company, which is less than revenue since part of revenue is procured costs. This research estimates procured costs and nets them from revenue to determine economic activity. Economic activity is deemed to be gross margin plus a portion of cost of goods sold.
3. Overall inventory for the U.S. economy is reported in CSCMP’s “2020 State of Logistics Report,” which can be found at cscmp.org.
4. It’s important to point out that inventory turn comparisons are only useful for very similar businesses. It’s unfair to compare companies against industry averages that may mix different types of businesses or business models. This is particularly true in the retail industry where different segments have very different characteristics.
What is market capitalization?
Market capitalization (“market cap”) is the value of a company as reflected in stock markets where buyers and sellers establish prices for its shares. Historically, market capitalization has been thought to reflect a company’s expected cumulative future discounted cash flows. In other words, the value of a company today is based on how much cash the company will create over its lifetime (discounted for the time value of money). For example, if the market is placing a value of $1.7 trillion on Amazon (its market capitalization in Q3 2020), then the market believes Amazon will create that much cumulative cash over its lifetime. In 2019, Amazon created roughly $25 billion in cash, so a lot of what the market says about Amazon is an expectation of its future value.
Market capitalization is an independent measure of how a company is performing across a wide variety of variables. It is an output of operational results and a measuring stick for comparing companies. In fact, many senior executives are measured and paid based on their company’s market performance relative to a market index or peer group. Market capitalization is also tied to the structure and dynamics of the industry in which the company competes, with some industries having much higher average market capitalizations than others.
It is important to note that any market cap comparisons must adjust for, or at least note, outliers. In established industries, it is relatively easy to compare established players. However, disrupters are sometimes outliers, since investors may be placing a lot of weight on future prospects. For example, in the automotive industry, Tesla’s operating structure is similar to other automotive companies, but its market cap multiple is much higher than other companies in the industry.
Furthermore, while markets have an uncanny ability of predicting the future, they can be spectacularly wrong at predicting individual winners and losers. It is also important to note that market caps fluctuate, sometimes dramatically, and that any analysis including them is based on a point in time.
Recent Comments